M4 Master BundesEcho Bringing visibility to the political echo.

Team

  • Zaynab
  • Merveille
  • Konstantin
  • Zidanie
  • Sonja

Supervision

Bruno Schilling

Intelligent Data Pipeline

Automated Collection
BundesEcho continuously synchronizes with the source platform to ingest newly published citizen Q&A threads, keeping analyses up to date.

NLP Enrichment
Each entry is automatically analyzed and enriched with structured signals:

  • Context: Education and professional background
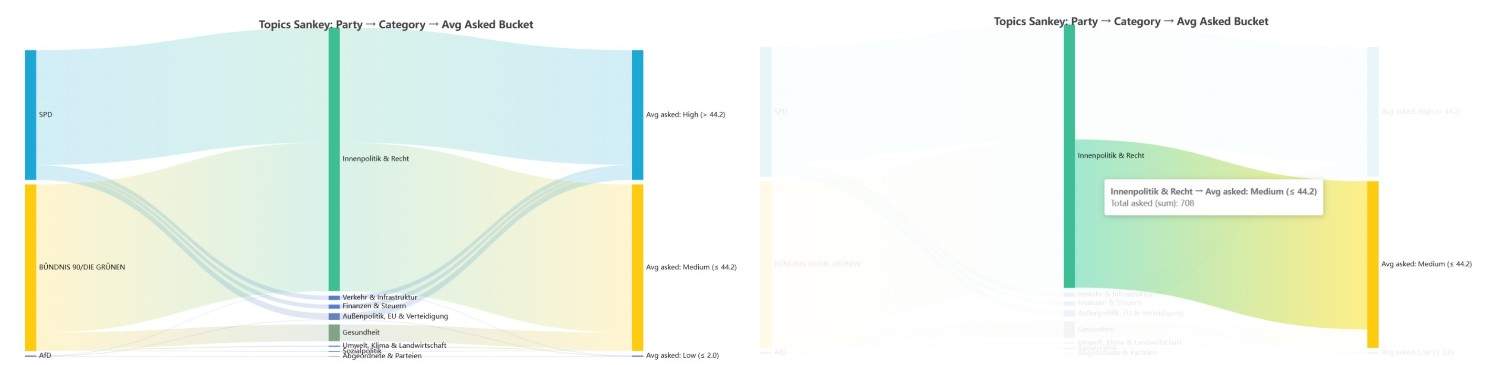
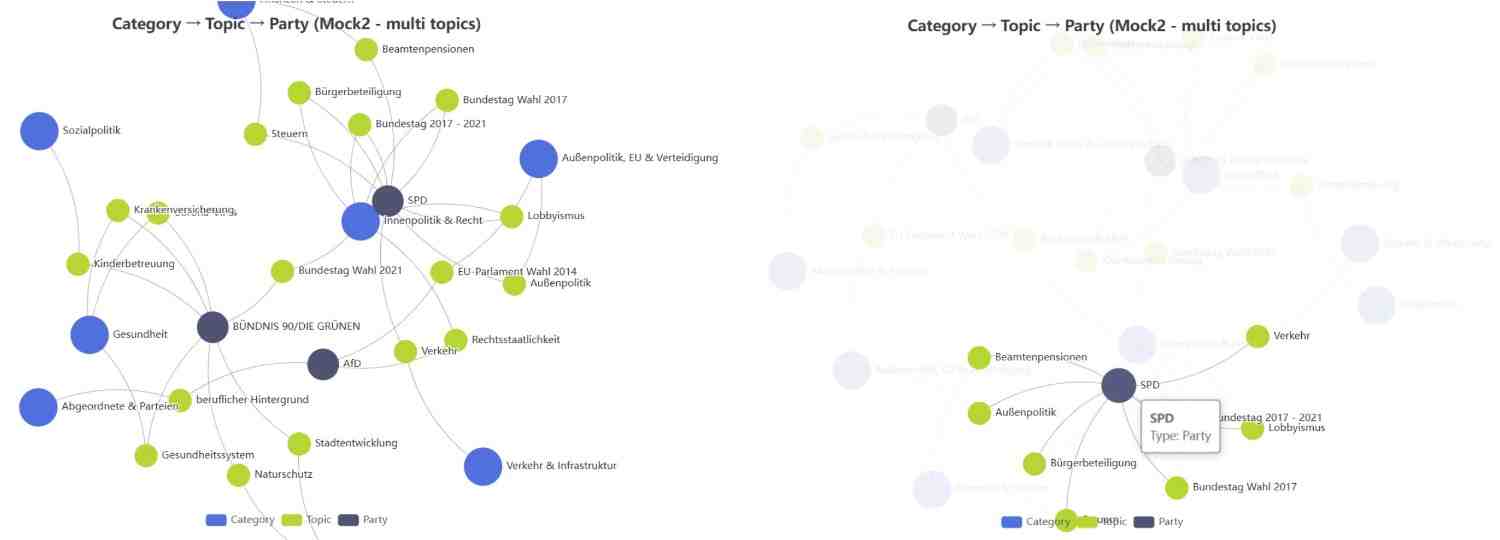
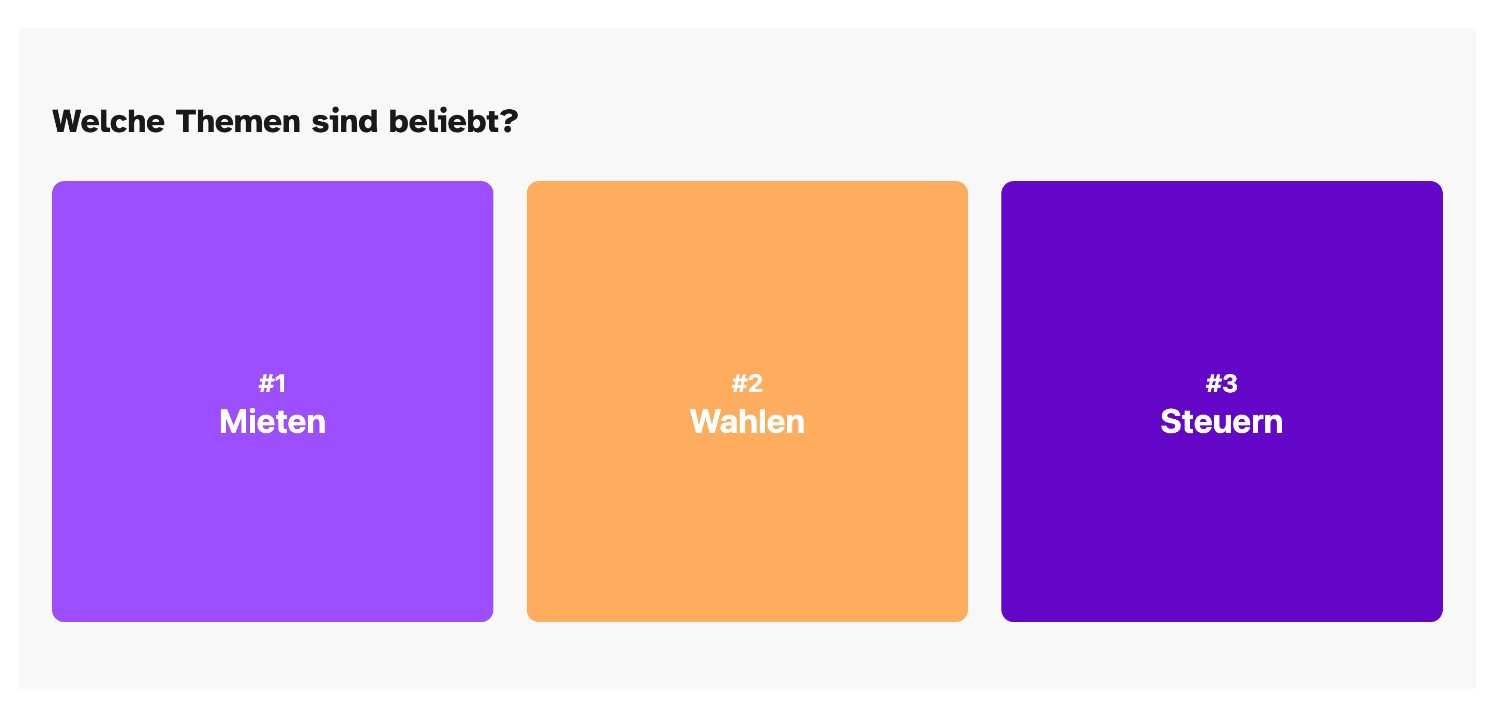
  • Topics: Assignment to core policy areas
  • Rhetorical Clarity: Direct, Vague, or Evasive
  • Positioning: Directional stance detection

Semantic Representation
All entries are embedded as semantic vectors, enabling meaning-based search and powering the RAG features.

Optimized Access
Enriched data and vectors are served via a high-performance API for fast, reliable access.

Advanced Political Analytics

Directional Positioning
Political statements often go beyond simple pro or contra. BundesEcho applies a three-way stance model:

  • Expanding: Advocates policy growth or support
  • Limiting: Supports restriction or tighter regulation
  • Status Quo: Defends existing policies

Explainable Metrics
Every AI-generated classification includes a short reasoning summary, ensuring transparency and interpretability.

Topic flow visualization

Interactive Data Visualization

Dashboard Visuals
The frontend uses Apache ECharts for interactive exploration:

  • Sankey Diagrams: Visualize how questions flow from topics to parties
  • Parliament View: Interactive Bundestag layout with sentiment and response-time insights
  • Topic Sunburst: Drill-down from main categories to trending sub-topics
  • Network Graph: Shows relationships between politicians, parties, and issues
Network graph visualization
Network visualization of political connections

Deep-Dive Analytics

Politician Profiles
Each member of the Bundestag has a dedicated analytics dashboard to assess their individual performance:

  • Activity Timeline: A bar chart tracking the frequency of questions answered over time.
  • Thematic Focus: A Pie Chart highlighting the “Top 5 Topics” addressed by the politician.
  • Sentiment Gauge: A distinct visual meter showing the average rhetorical clarity and tonal sentiment of the politician’s answers.
Most popular topics
Most popular topics

Category & Search Metrics

Category Insights
Aggregated metrics per policy area include:

  • Total questions, response rates, and average response times
  • Party-level engagement comparisons

Semantic Search & AI Summaries
Users can search the dataset using natural language. Results are matched by meaning rather than keywords and summarized using AI, grounded in the original data.

AI-summarization interface