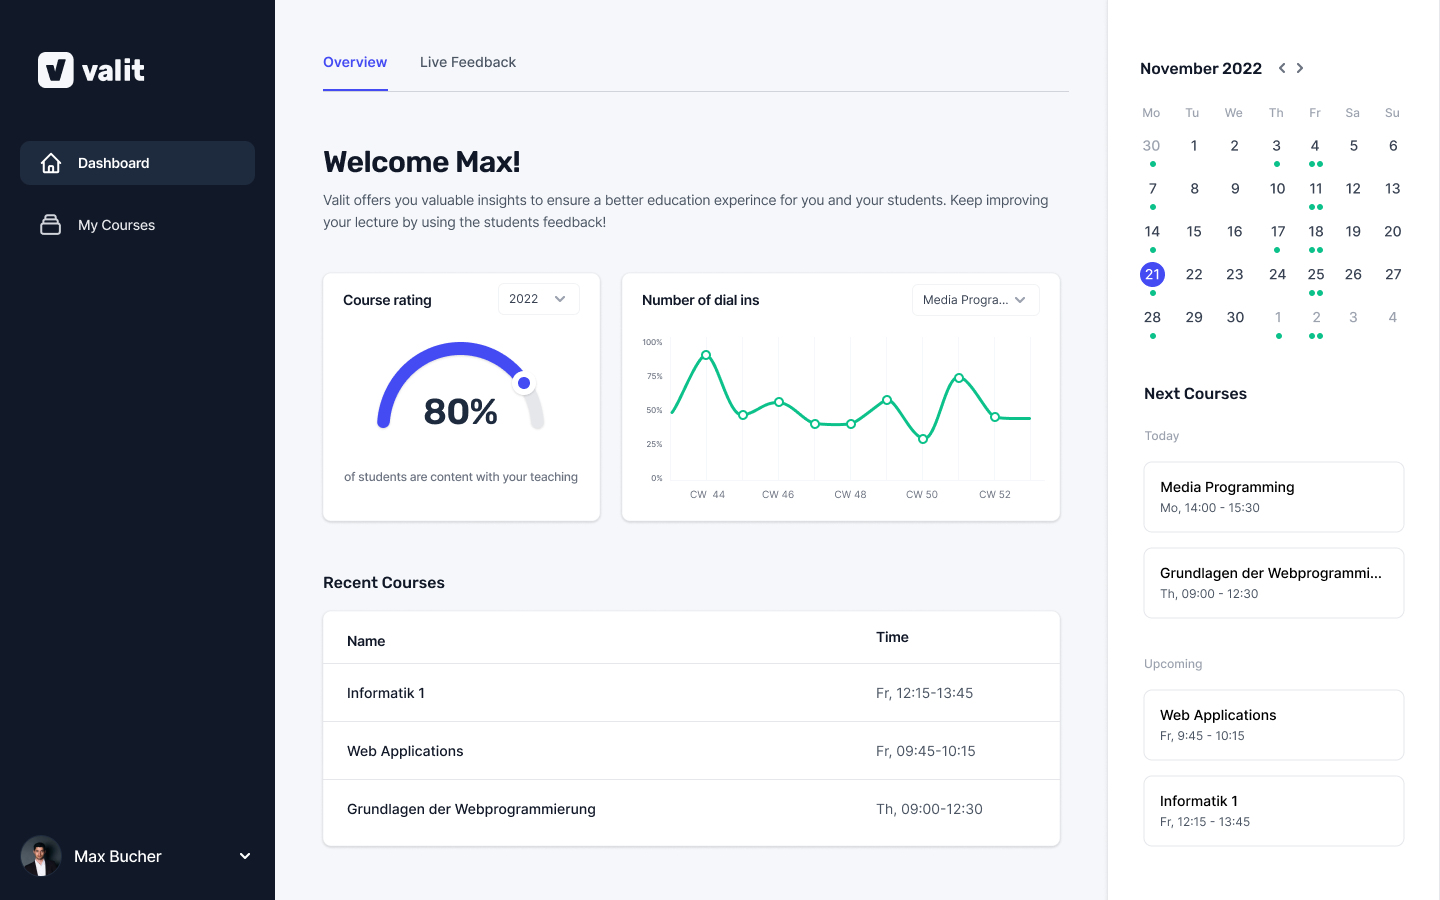
Dashboard
The dashboard overview shows important statistics such as the overall course rating and the number of dial-ins. Recent courses for quick access and also upcoming courses, along with a calendar are provided.
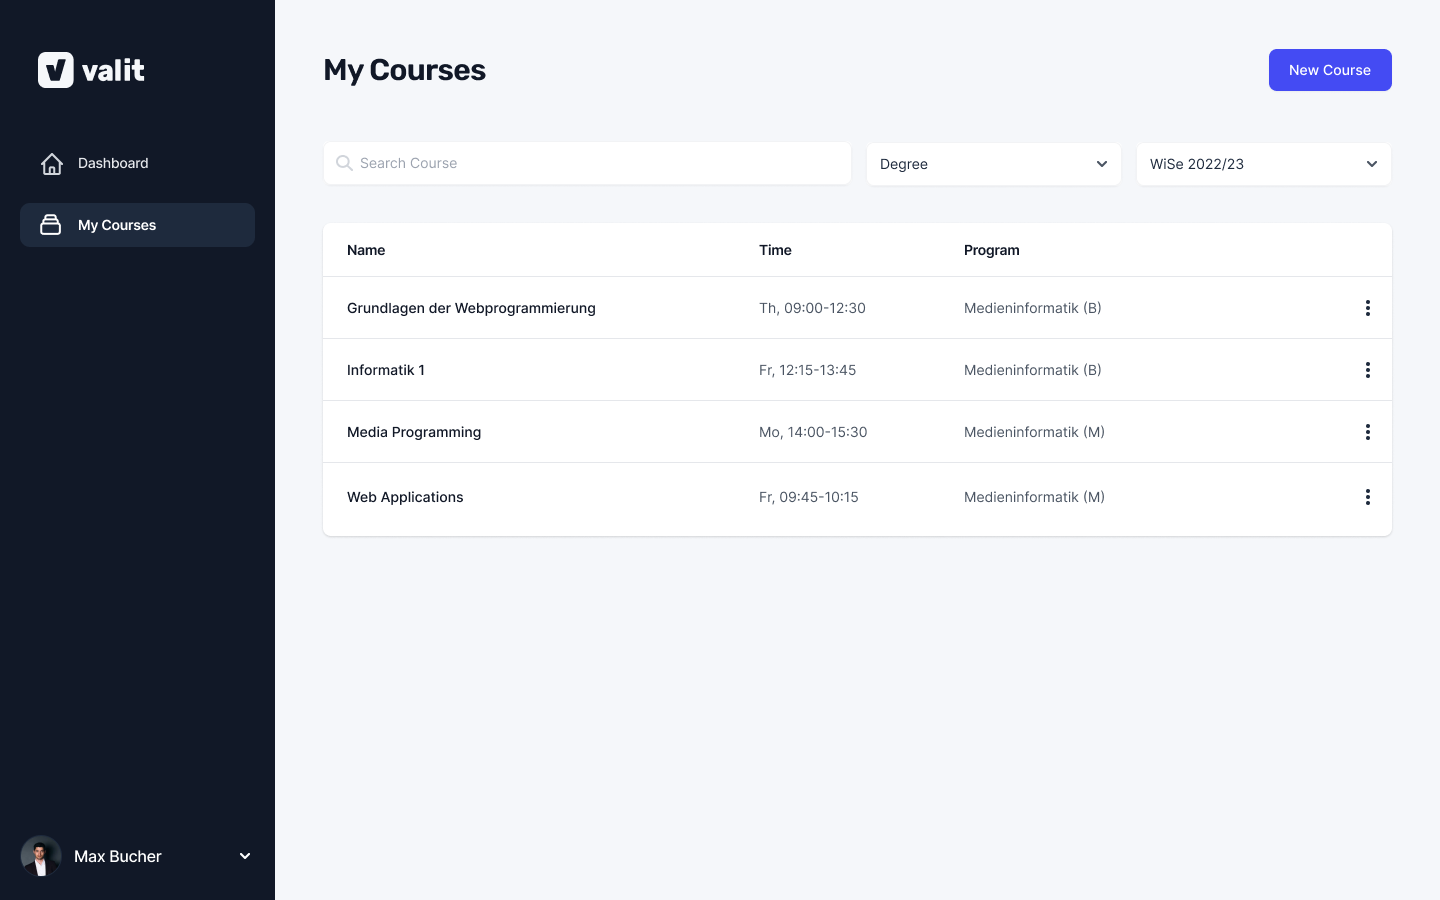
Course Overview
The course overview displays all courses of the lecturer with related information such as semester, degree, program, etc. The lecturer has the option to create a new course, so the application automatically creates an evaluation on the given dates.
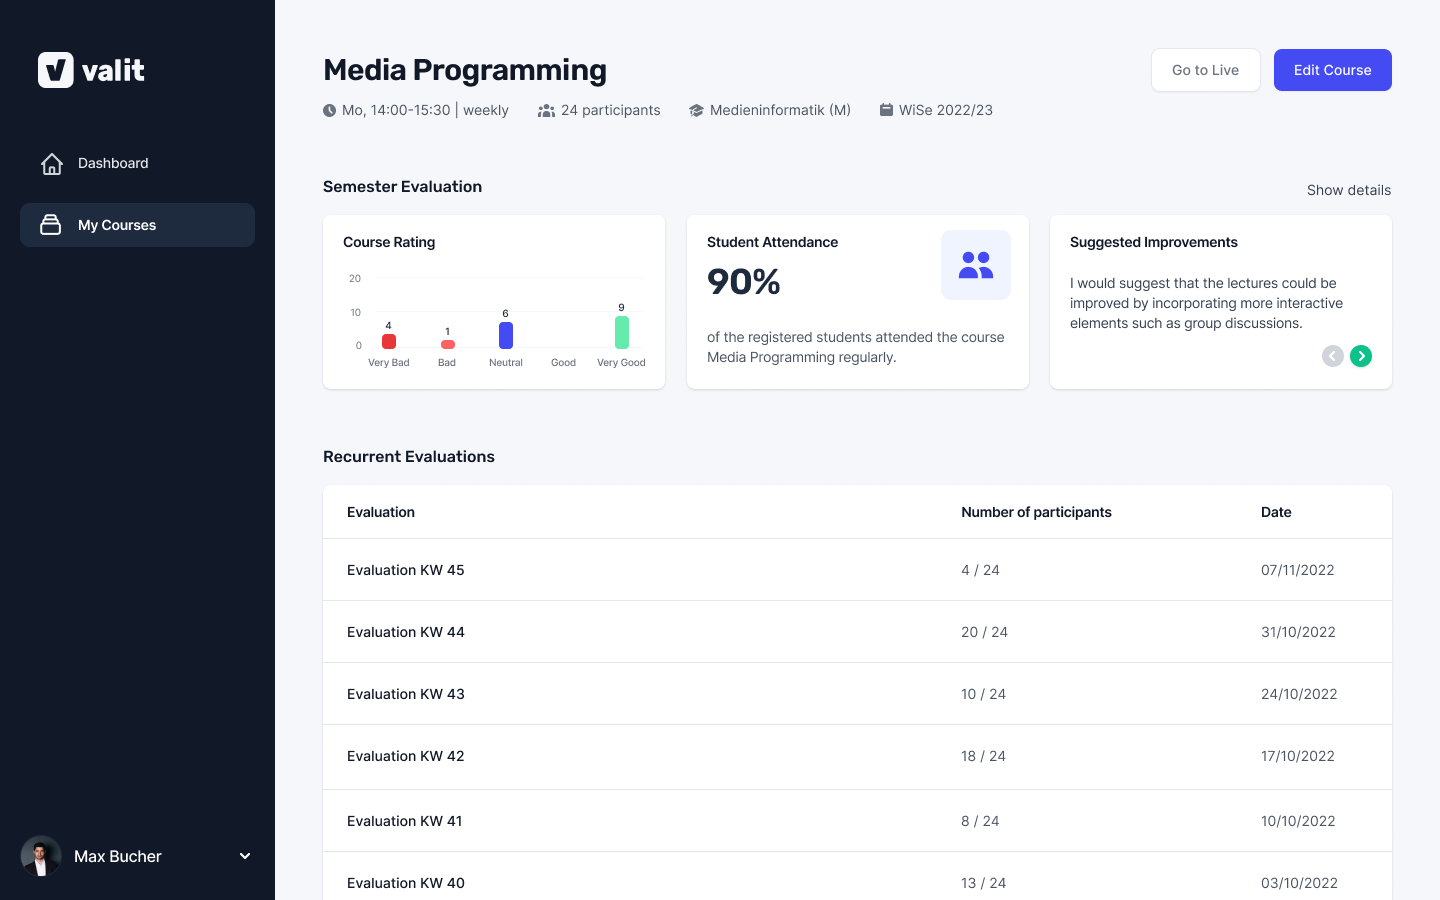
Course Detail
The course detail view displays the most important statistics about the semester evaluation: the overall course rating, the course attendance, and some suggestions from the student feedback. This view also lists all of the recurring evaluations for this course which can be explored further by selecting one.
Evaluation Answers
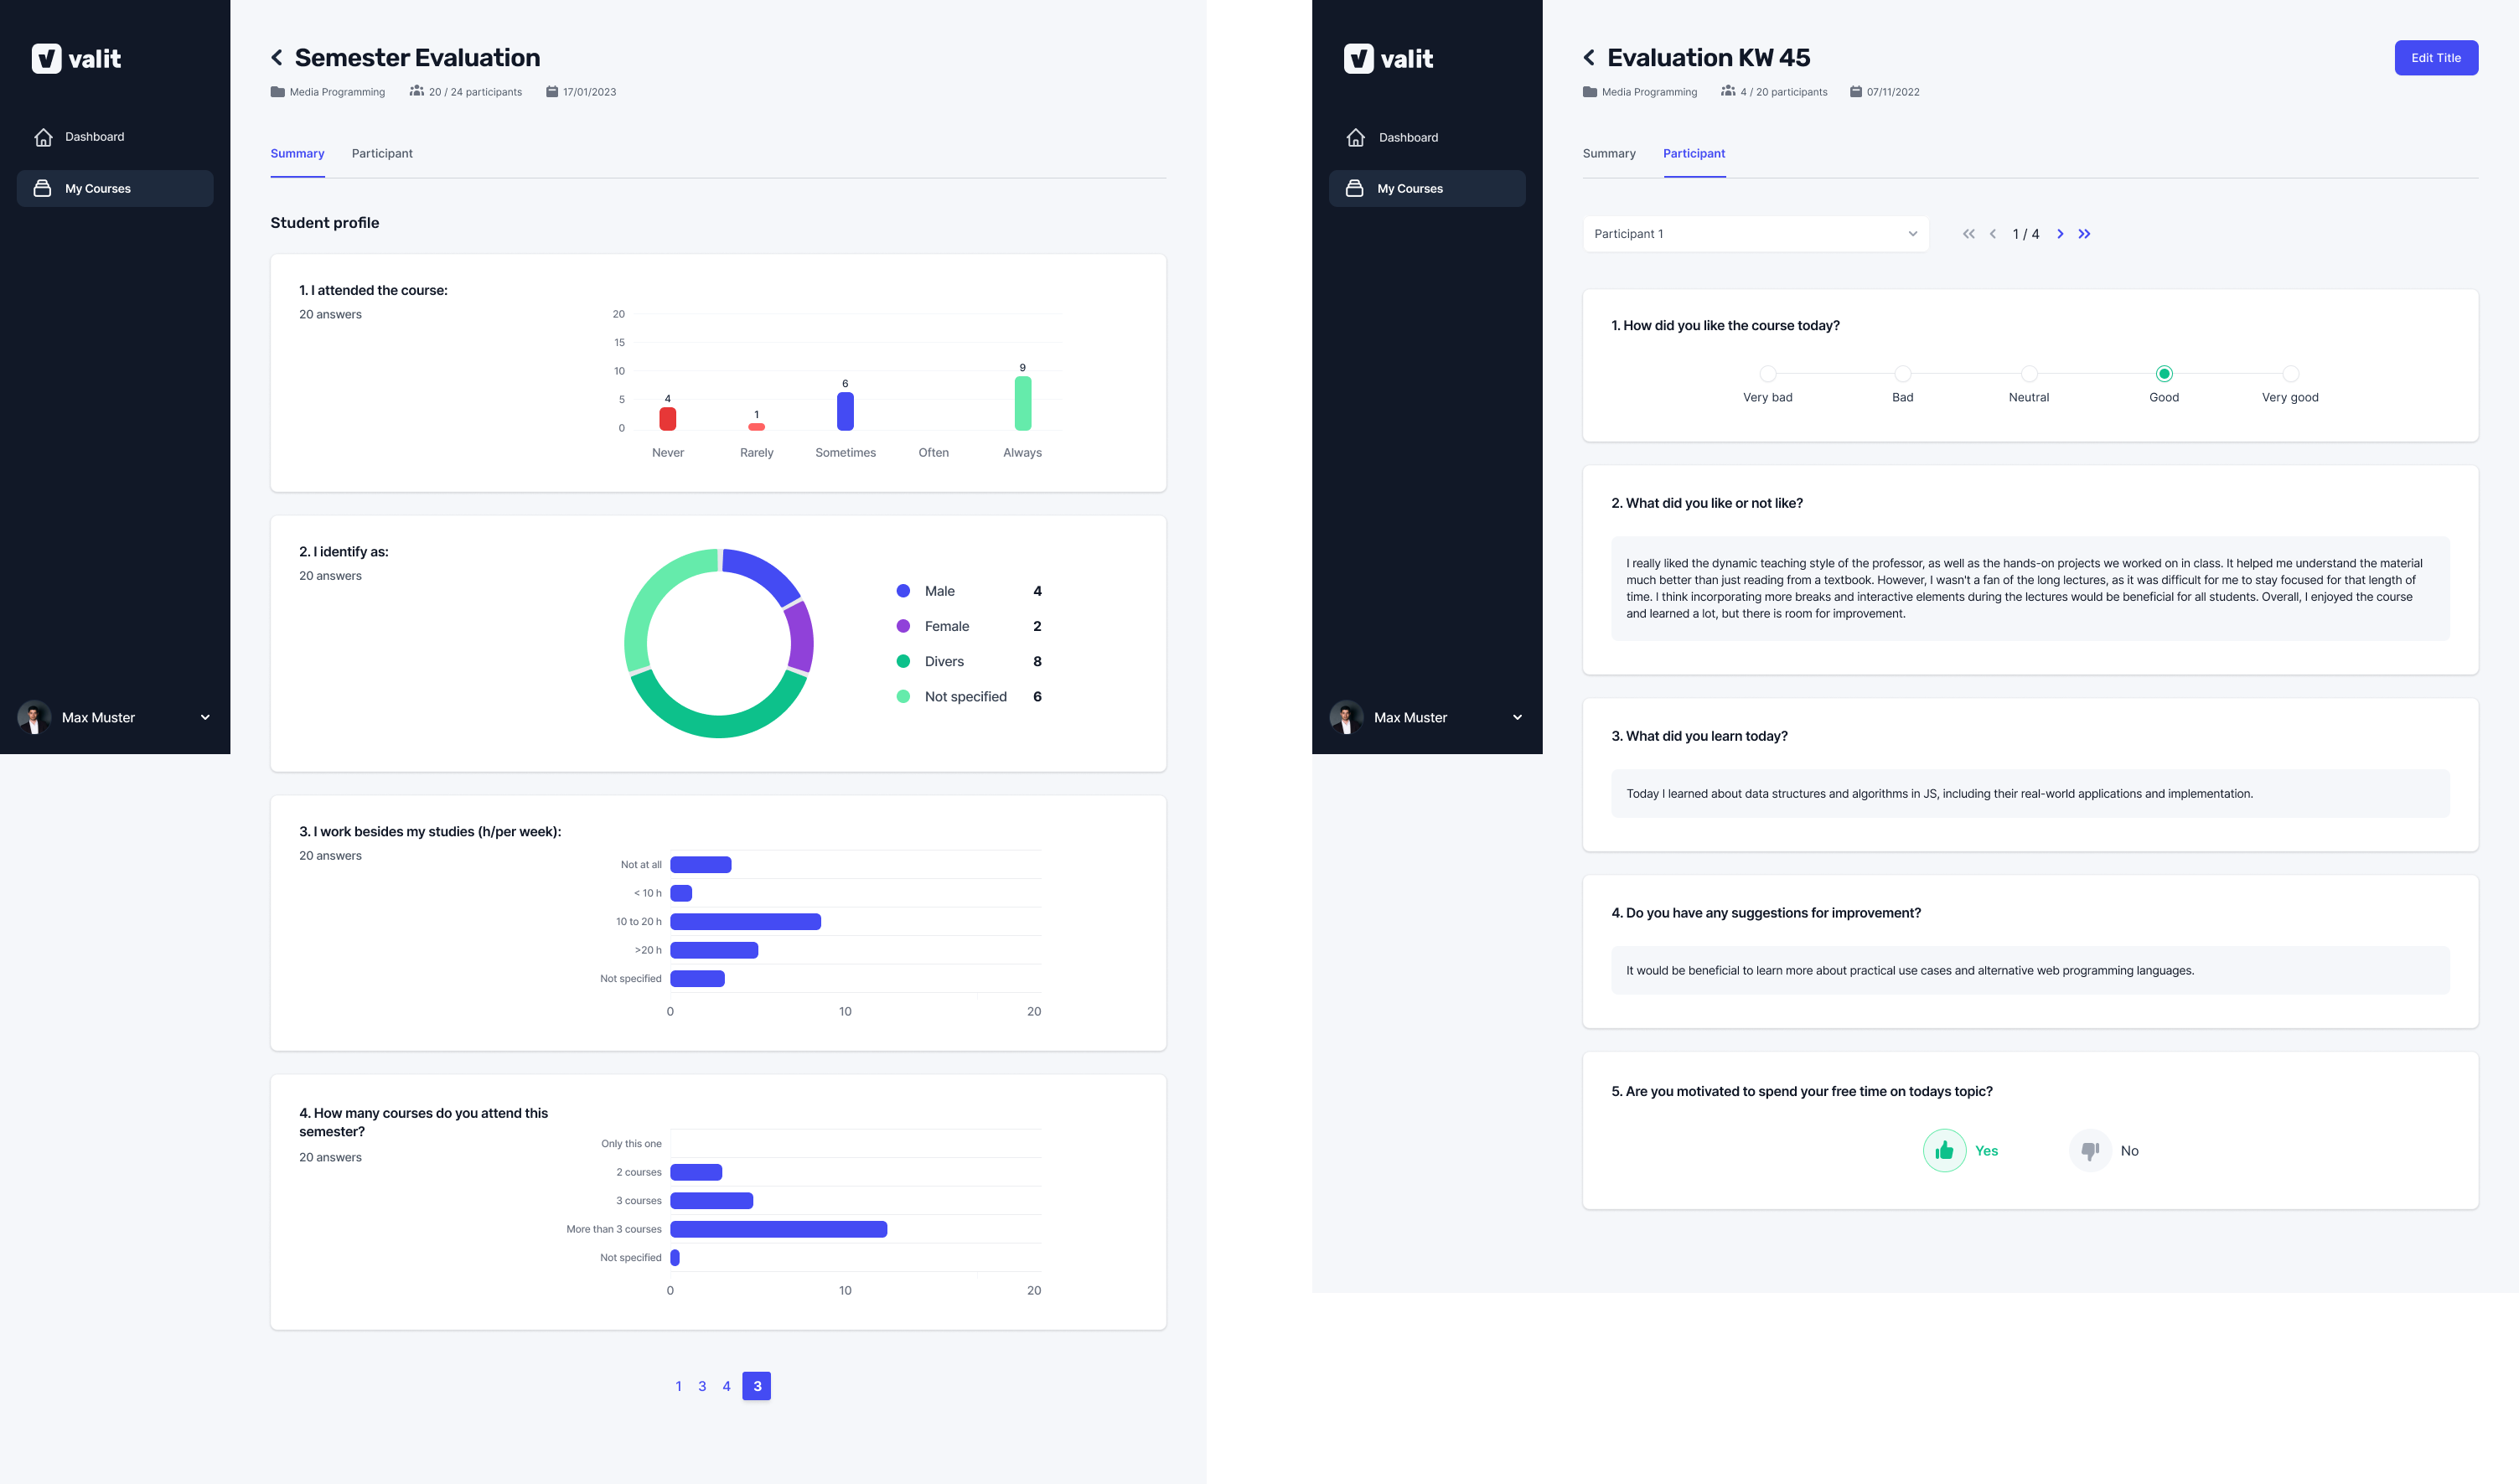
By selecting one specific evaluation, Valit shows each answer in an appropriate summarized visual presentation. The semester evaluation is subdivided into the same sections as the questionnaire. The answers of each evaluation can be inspected as a summary or per participant.
Lecturer Live Feedback
From within the live feedback tab, lecturers can present the QR code of the running lecture for quick and easy dial-ins. Participant feedback and votes show current results and a picture-in-picture button can create a new widget with these statistics, so it can be displayed anywhere on the screen without having to keep the browser tab open.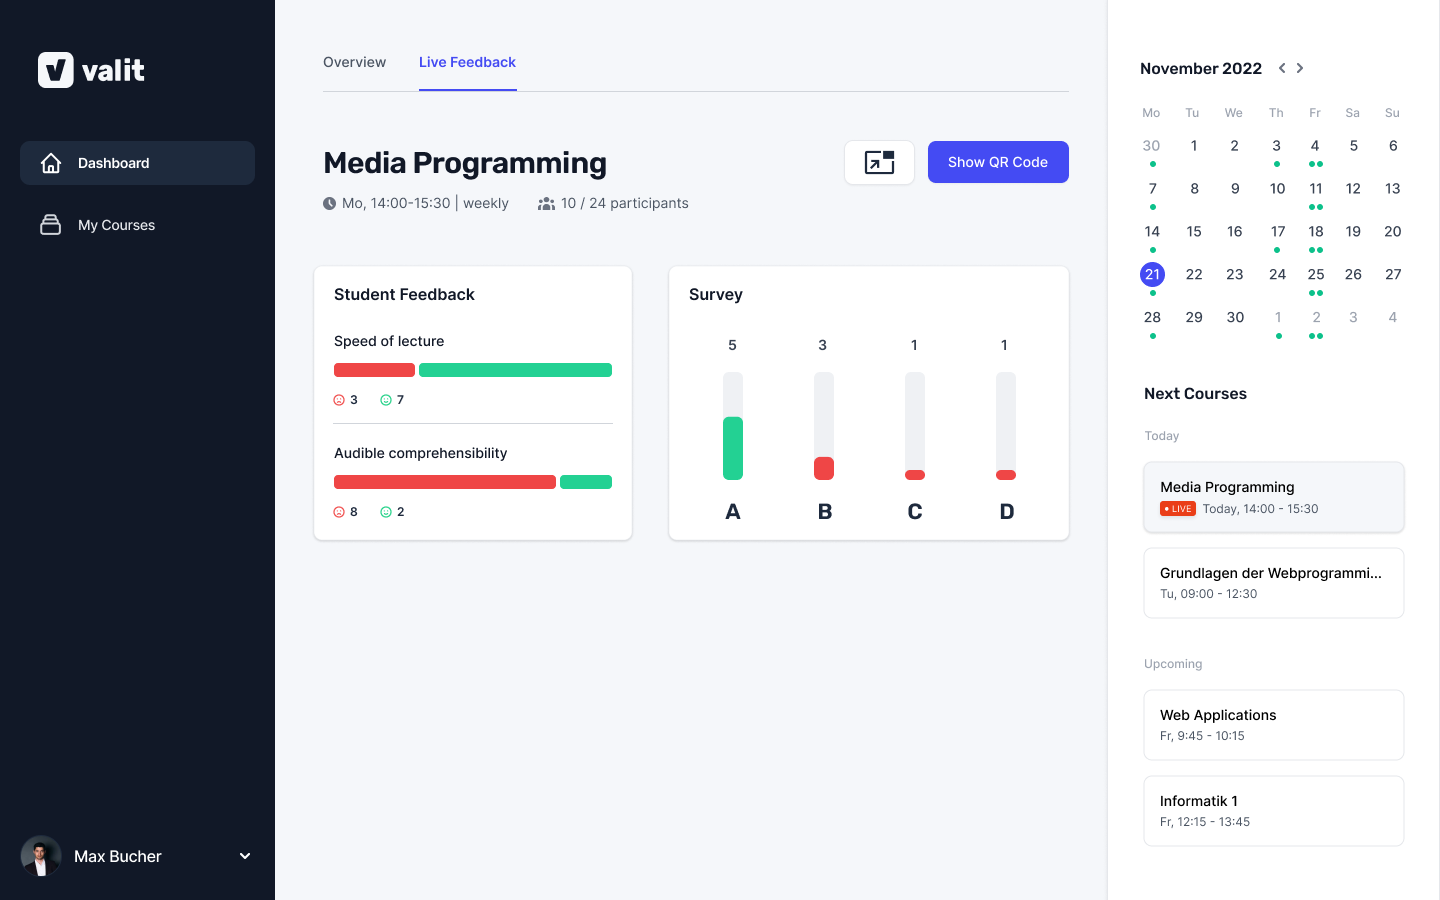
Student Live Feedback
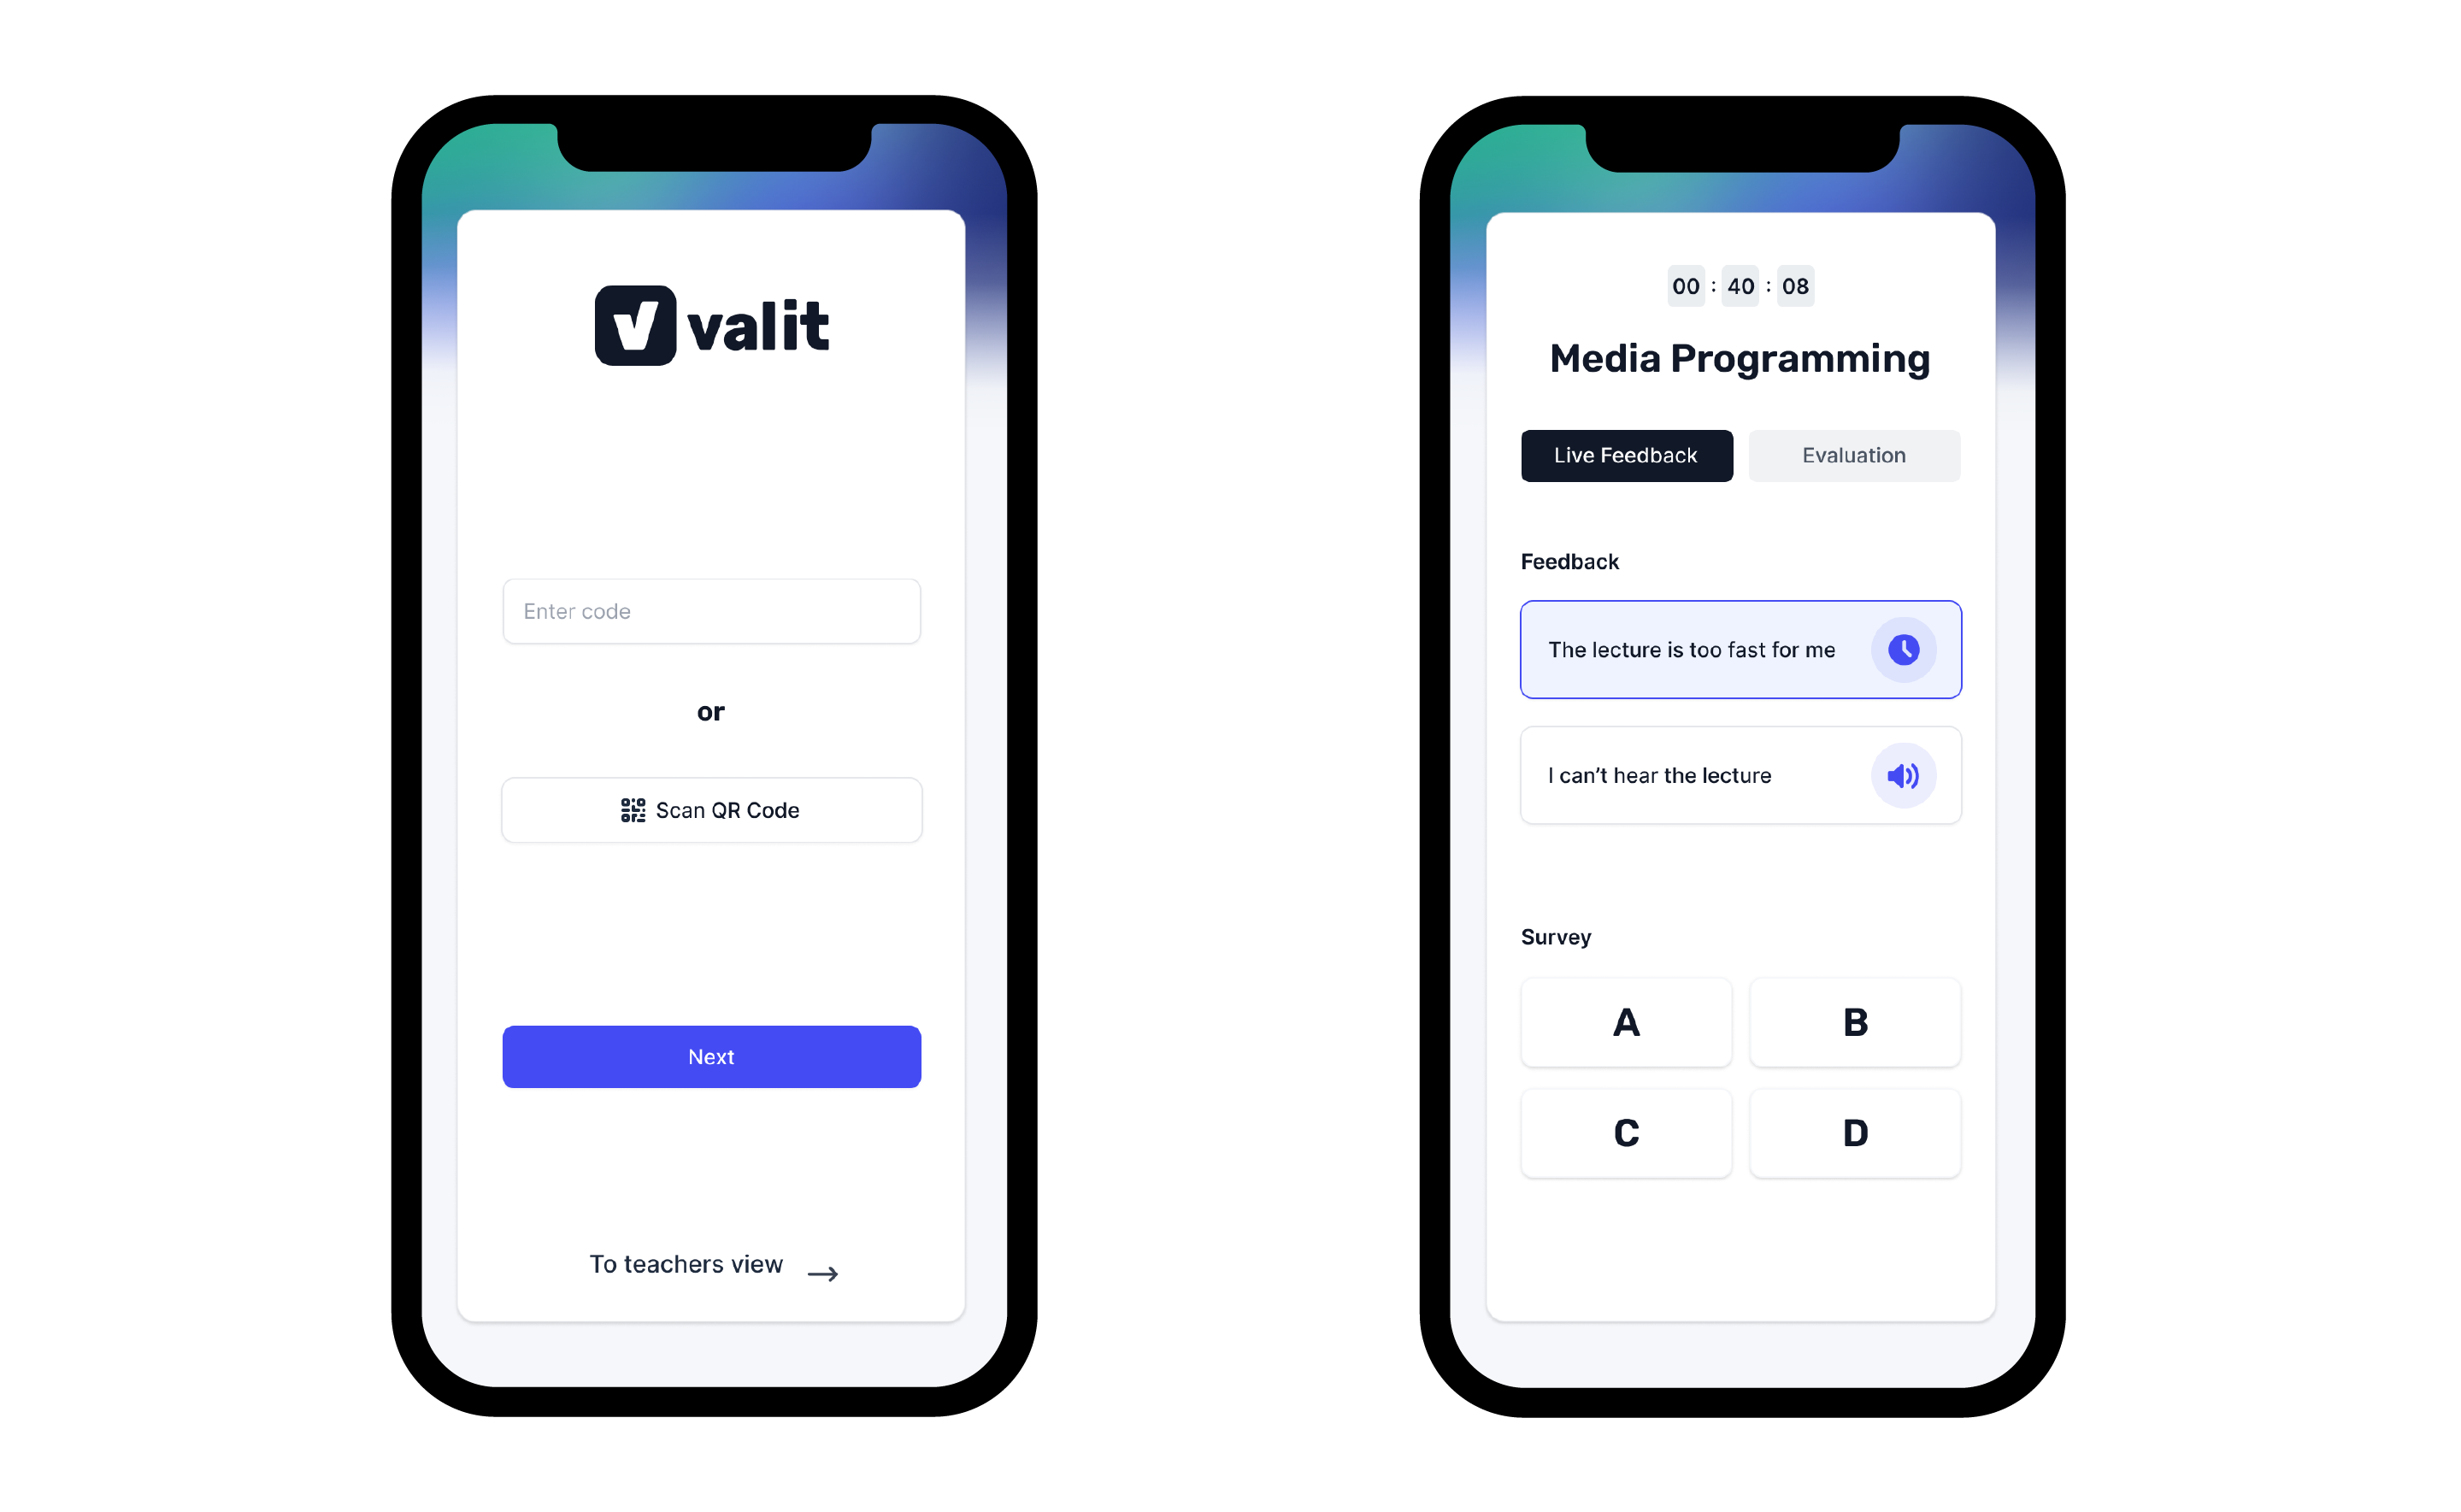
The student has the ability to join the live feedback functionality by scanning the QR code or entering the short code.
From the live feedback tab, the student can enter quick actions regarding the speed of lecture and the audio comprehensibility.
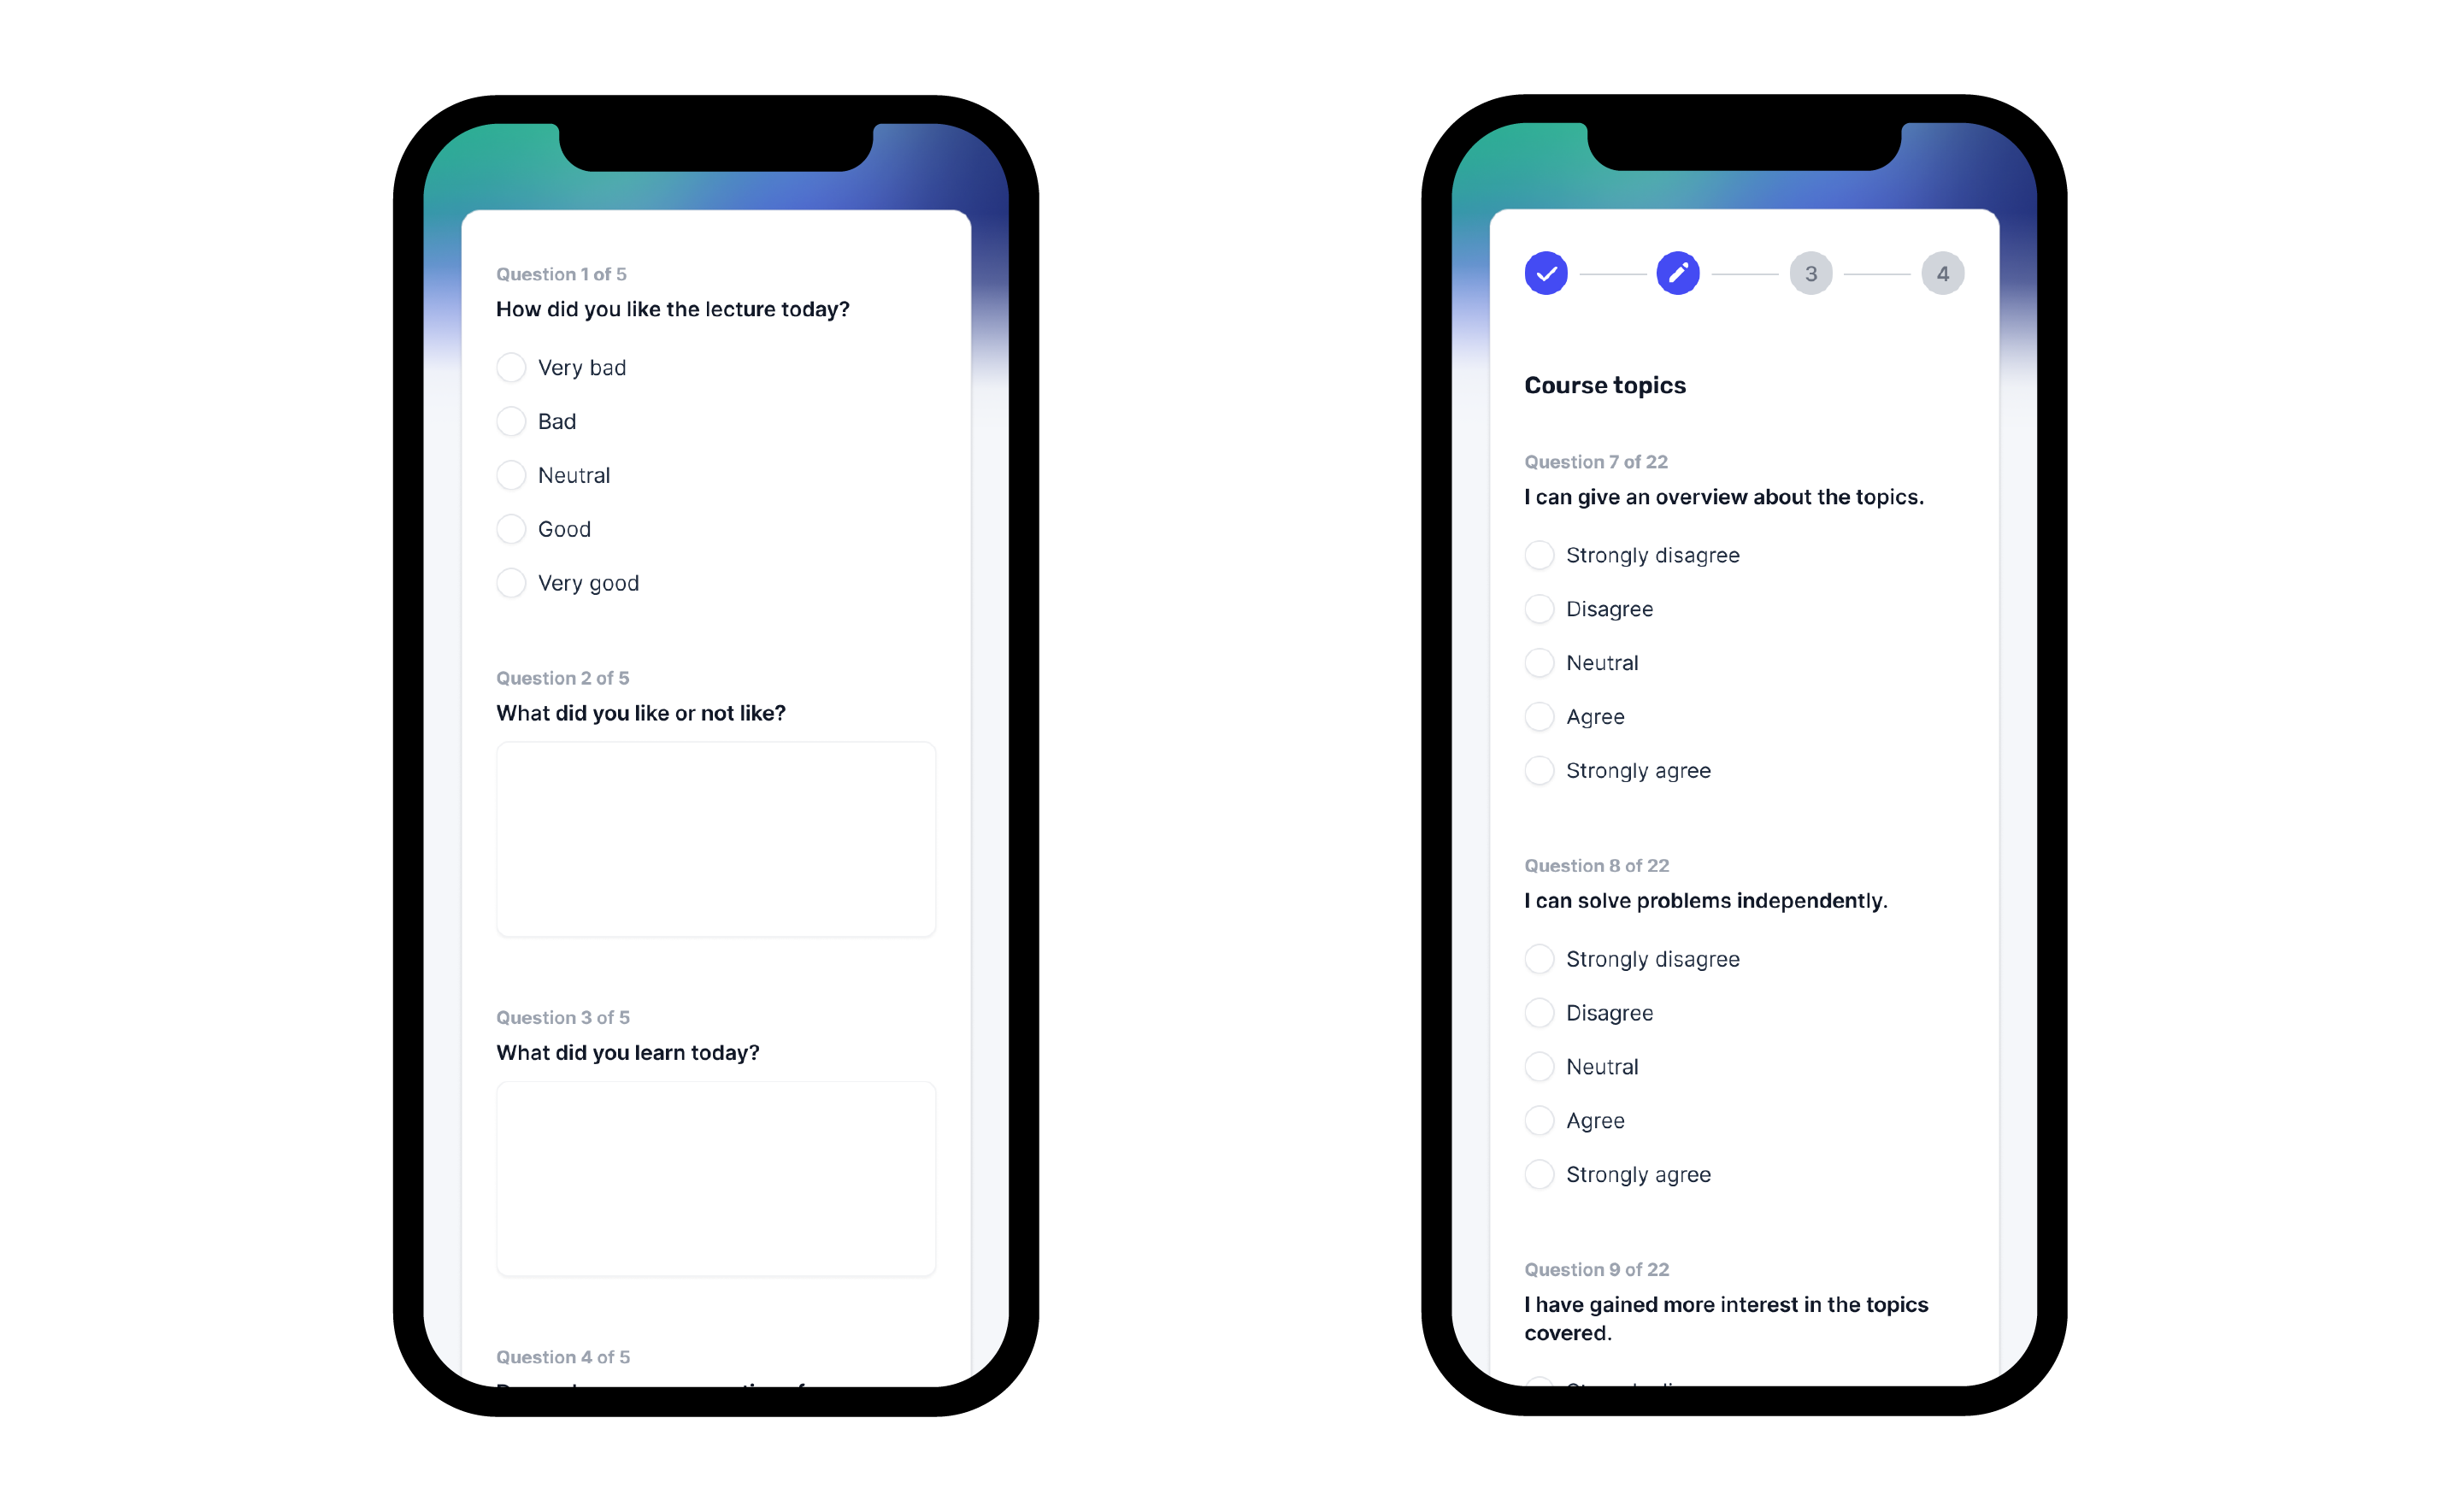
Evaluation Questionnaires
Once the lecture is over, the students can access the questionnaire in the evaluation tab and enter their answers. When it’s time to answer the semester evaluation, the questions are divided into smaller chunks to reduce cognitive overload.
