M3 Master Find-IT

Team

  • The-Anh Nguyen
  • Nhu Mong Tran
  • Malin Dulkies
  • Mischa Koischwitz
  • Cyrine Ben Romdhane

Supervision

David Koschnick, Marco A.

Preparation

Diagram of the first phase of the project
Steps in the preparation phase

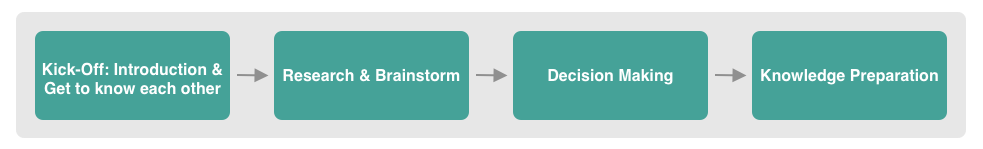
This is the first IMI Showtime for some of our group members. In general, we knew what was ahead of us to reach our newly shared goals. After kicking off the project and getting to know each member’s strengths and preferences in the scope of the project, as well as our supervisor’s visions, we excitingly head on moved to the brainstorm and research phase. Tools such as Miro and the Gitlab board were of great help to manage the ideas and visuals. In this phase, we clarified questions, collected functional ideas from each member, talked about available technologies and initial visuals of the application. In addition, one of the core tasks was to conduct data research, which was lead by our supervisor Marco A. Afterwards we had to make decisions about our chosen tech stack. We defined functional and non-functional requirements, as well as visions and goals. A low-fidelity design had been prepared to visualise the ideas resulting from the brainstorming sessions. Finally, the last step of the overall preparation phase was to acquire the necessary knowledge and missing data to initiate the development. At that point, the preferences of each team member were clear, thus the team was separated into two sub-groups: Frontend (consisting of Mischa, Malin and Nhu) and Backend (consisting of Cyrine and The-Anh).

Strengths and preferences

To get to know each team member, we documented everyone’s skills and likings in a ticket in GitLab. This really helped us find correlations to common skills within the team to later decide on the tech stack. The teams were also separated based on everyone’s interests.

Research

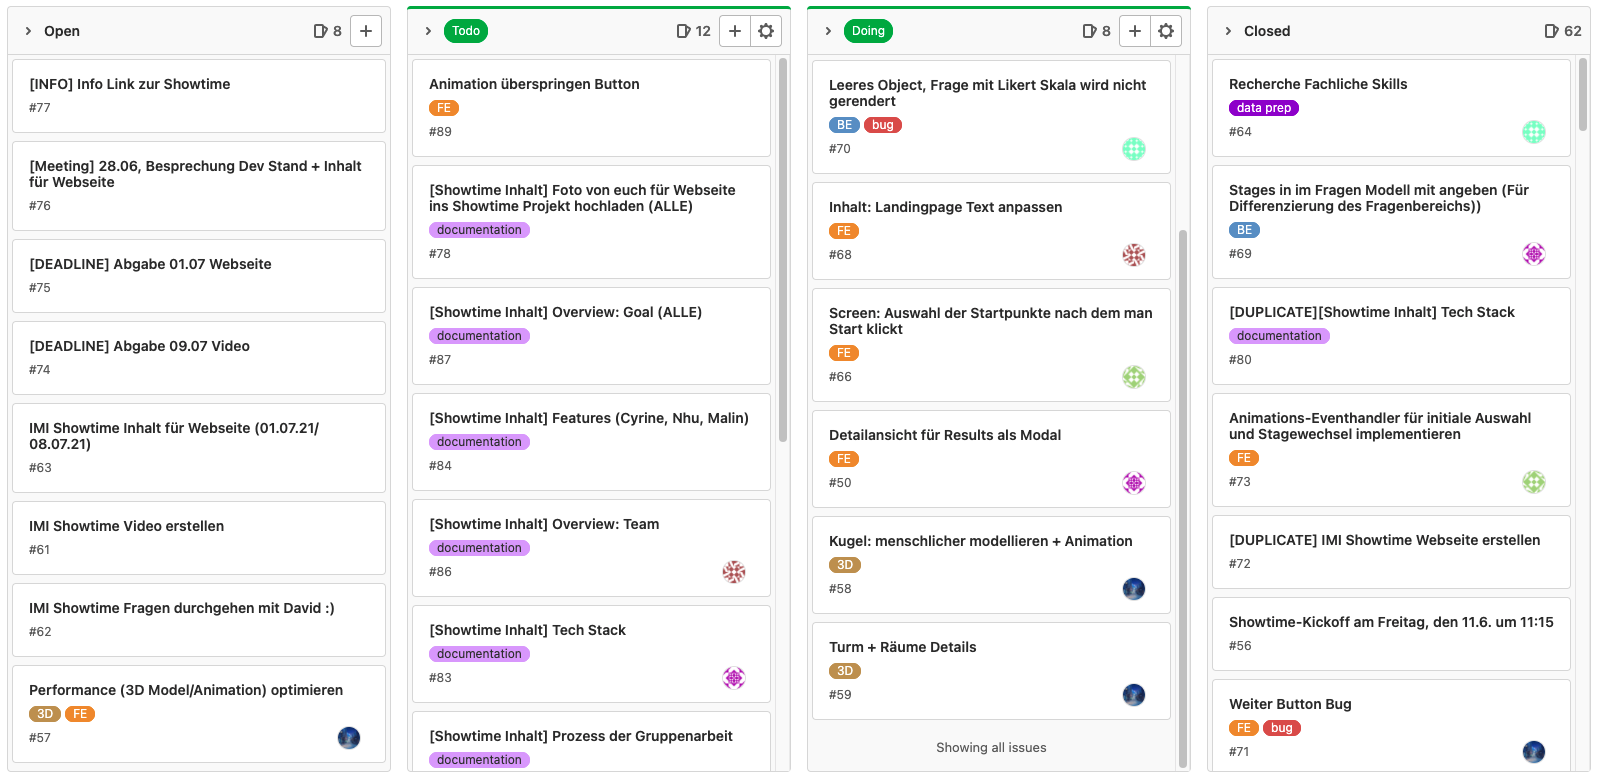
Researching was one of our core task (see section “Research” below).

Brainstorming

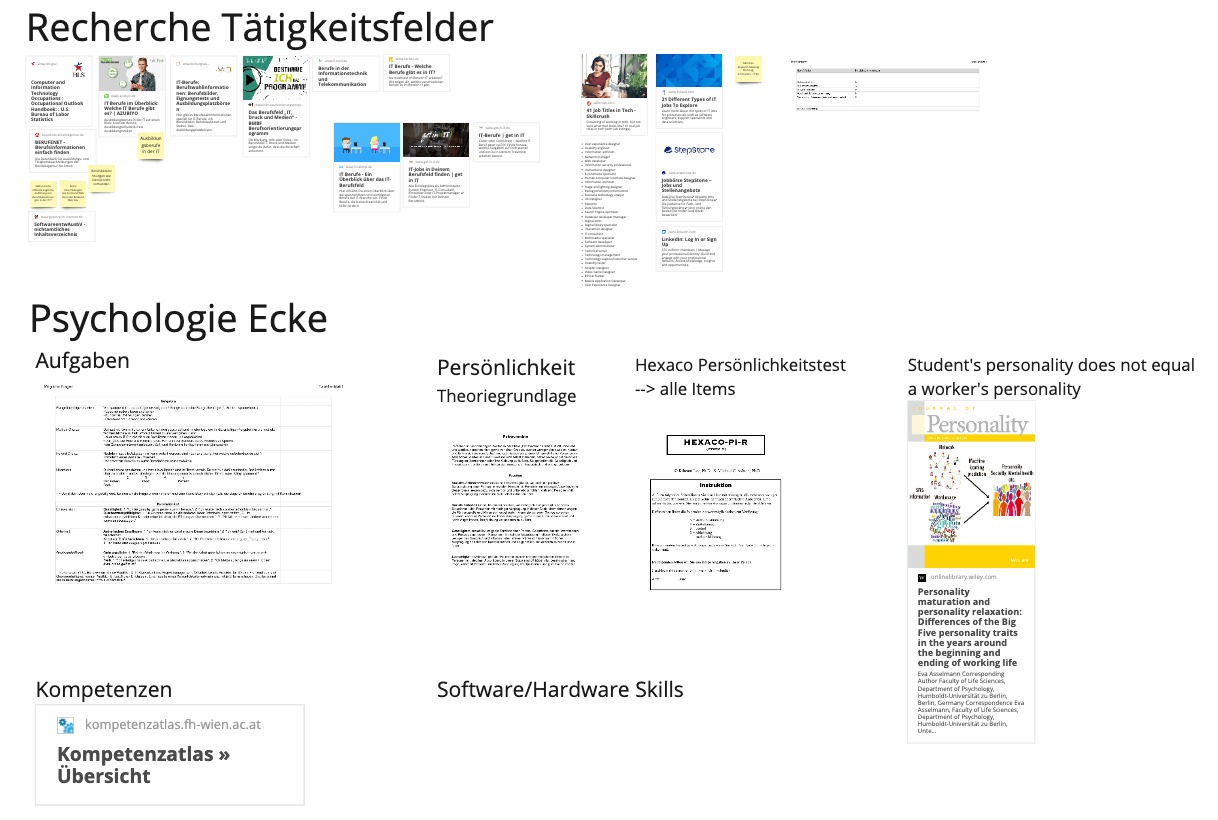
The first five meetings were mainly about forming a common goal and a shared view within the team. We kicked off with a brainstorming session in which various ideas were introduced and elaborated on. Results from the sessions were documented in our Miro board and in the related ticket in GitLab. Topics which were of importance for the decision making:

  • Functional and non-function requirements

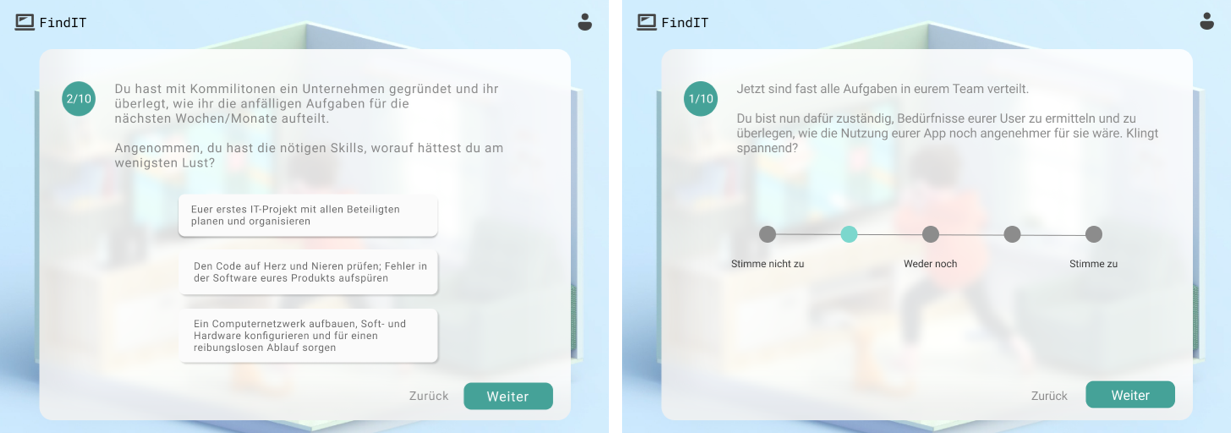
  • Frontend: Desktop-first or mobile-first? Colour palette? What kind of user experience do we want to make? What should the feel and look be like? Which elements of gamification can we make use of? What technologies do we want to use?

  • Backend: What does our data model look like? Machine learning or expert engine? Which strategy will be used? Which logic should we decide on, fuzzy logic or bayes theorem?

    UI ideas and Inspiration board
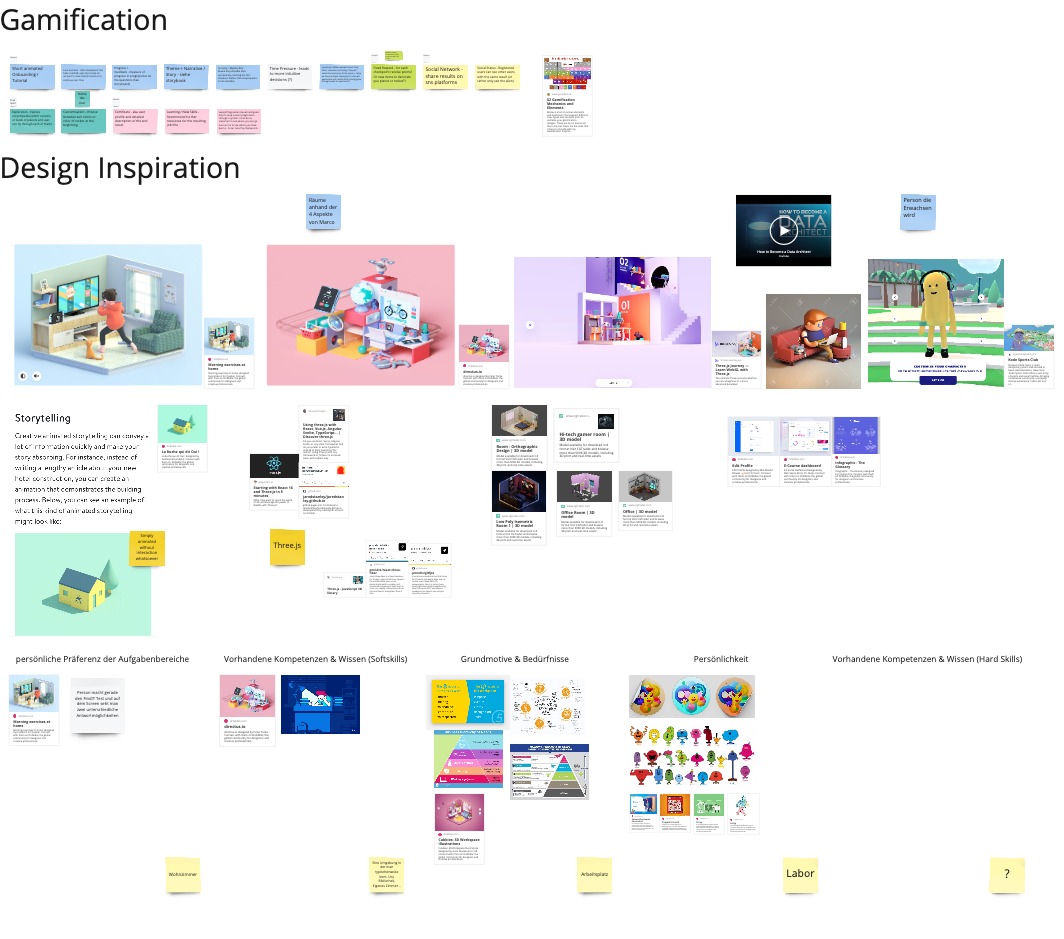
    Miro board: UI ideas and Inspiration board

Decision making

  • Tech Stack & Functional and non-function requirements
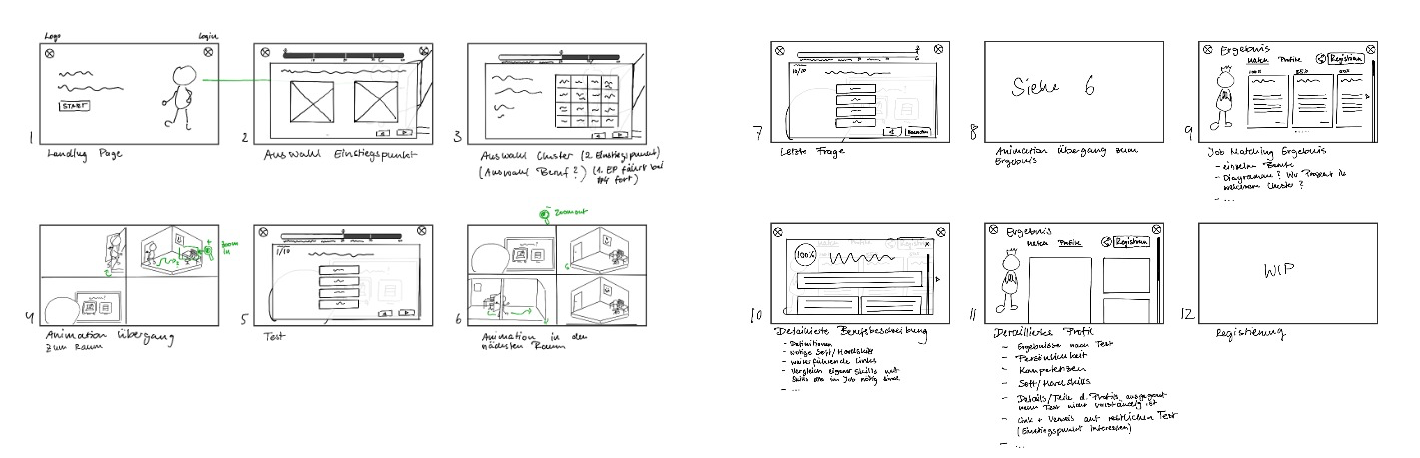
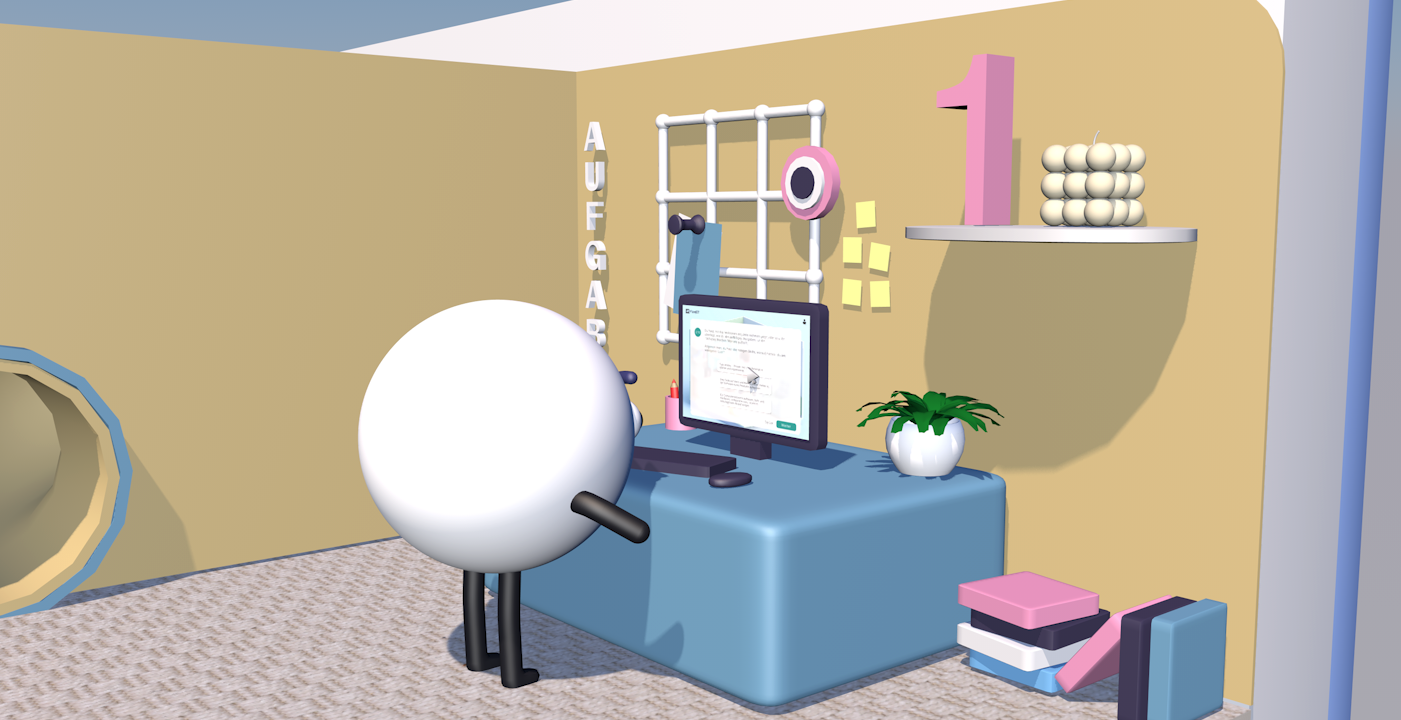
  • User Interface: The results from our brainstorming sessions were screen sketches and a storyboard for the animation (see section “Sketches & Storyboard” below), as well as a high-fidility design (see section “High-fidility Design” below), which has been created afterwards. The functional and non-functional requirements have been documented in GitLab.
  • Expert System: Further results from our brainstorm session was a draft of an expert system that works with heuristics (see section “Artificial intelligence engine” below)

Aquire missing knowledge

In the last step of the preparation phase, we acquired the needed knowledge as quick as possible. There were a lot of technologies, which were new to us.

Research

The collected data is the foundation of the success of our application. Results were collected in a shared word document and saved in our Miro board. The research was lead by our supervisor Marco A., who is working in the field of psychology. With the help of Marco A., at first, we researched 41 different types of IT jobs on the current job market, which was taken from an in-depth article on Skillcrush (https://skillcrush.com/blog/41-tech-job-titles/)). After we defined some of the job titles (common tasks and requirements taken from three popular employment websites: LinkedIn, Stepstone and Indeed), we realized that conducting the research manually was not the way to go. Thus we discarded the initial work. We agreed on using german resources and therefore narrowed down the mentioned job titles from IT-Talents (https://it-talents.de/it-karriere/it-berufe/) and Get-In-IT (https://www.get-in-it.de/magazin/arbeitswelt/it-berufe), which we clustered into nine divisions following the clustering from Get-In-IT (https://www.get-in-it.de/berufsfelder).

Tasks

Afterwards, we picked one job of each division for our MVP. We assume that a basic interest in the most important tasks for each profession can predict that one will have “fun” in that profession. For the tasks, Marco A. looked at the main tasks for each profession on the platforms it-talents.de, berufenet, Brunel and get-in-it.de. From these, He selected the tasks that were mentioned on all platforms, i.e. the ones that seem to be the most important.

Personality

We know from work and organizational psychology as well as from personality psychology that personality has an important influence on the professional activity performed. An introverted waiter at the Oktoberfest will similarly feel out of place as an adventurous accountant filled with drive. There are several models that describe personality, we have chosen the Hexaco (Ashton & Lee 2006) because it is scientific, modern and very culture-independent. The personality traits relevant to each occupation are hypotheses that we inferred from the task descriptions for each occupation.

Competencies

We assume that one must have certain competencies to be successful in an occupation. Here we expanded the presupposed competencies, which berufenet provides us around important competencies from the model most usual in the competencies research “Kompetenzenatlas” (Erpenbeck & Heyse 2007, https://kompetenzatlas.fh-wien.ac.at/?page_id=1096), by extrapolating the competencies needed to successfully perform the job directly from the tasks themselves.

Hard skills

Starting off, we defined the skills required for our available jobs. To be more specific we extracted the most important tasks required for each job and also defined the specific soft and hard skills needed to perform the task and to feel a sort of satisfaction while doing the task. For the tasks of each profession, we visited various platforms and selected the most important tasks.

Cluster of research findings
Miro board: Cluster of research findings

Visual Design

Sketches & storyboard

The ideas from the brainstorming sessions were the foundation of the following hand-drawn screen sketches. We focused on creating a desktop-first user interface and chose to include 3D elements as supporting visuals, which mirrors the experience of our user. The sketches should give an overall overview of the use of the application. During this phase, we also began prioritizing functionalities for our MVP.

Storyboard Sketches
Sketchy storyboard showing the animation and user flow

High-fidelity design

After the sketches were made, a corresponding high-fidelity design was created. In a group meeting, we defined the colour palette, the overall look and feel of our application and visuals of the different question types.

  • Colors: We chose three colours based on the 60/30/10 rule (https://dribbble.com/stories/2018/12/19/choosing-colors-for-web-design-a-practical-ui-color-application-guide). Meaning, 60% fills the background, 30% is used for headlines, paragraphs, etc. and 10% is used for buttons and links. Since we as a service want the user to feel comfort and security while using our application, we agreed on using a blue tint in the background, which is thought to induce calm and inspires the feelings of trust - the trust in the process and result of this survey. A grey tone, which is a neutral and quiet colour, is used to convey the content of our application. To enhance the feeling of comfort and reliability, we chose a green tone as our 10%. (https://graf1x.com/color-psychology-emotion-meaning-poster/)

  • Interface elements: We went along our guts and followed standards for the design of the controls and display of information. We did not want to reinvent the wheel and force our users to learn something new, but rather meet the existing expectations and experiences about questionnaires of our target group. We focused on the essentials regarding the content and controls. The 3D elements in the background support our user’s primary goal.

  • Mockup of the test
    Mockup of the app (Source of the used dummy background image (last seen: 29.06.21): https://dribbble.com/shots/10983008-Morning-exercises-at-home)

Supporting 3D elements & animation

With the help of a colourful animated 3D visualisation, we wanted to create a fun way to accompany the user throughout the four segments of the questionnaire. We wanted to create a comforting virtual bubble, in which the user can embark on the journey on finding the right place in the vast field of computer science. As the user goes through the different stages of the questionnaire, the animated character in a shape of a ball also embarks on an adventure. Starting from the top of a tower, it rolls through cheerful tubes into rooms depicting the current stage. The character mirrors the user, as well as one’s need to find a place in the IT industry. This is not only a joyful experience but also serves to follow the progress of the questionnaire. Each segment has been visualised individually. Therefore, we have the following rooms:

  • Tasks Room

    Screenshot of the 3D Model of the task room
    Screenshot of the 3D Model of the task room
  • Personality and competencies Room

    Screenshot of the 3D Model of the personality and competencies room
    Screenshot of the 3D Model of the personality and competencies room
  • Hardskill Room

    Screenshot of the 3D Model of the hardskill room
    Screenshot of the 3D Model of the hardskill room
  • Results Room

    Screenshot of the 3D Model of the result room
    Screenshot of the 3D Model of the result room

The 3D visualization process was a thrilling adventure with various ups and downs as we as a team jumped into it without much prior knowledge. We learned a lot about 3D modeling and animation with Cinema4D. Cinema4D has been chosen over Blender due to its intuitive user interface. We prioritized a flat learning curve. While working with Cinema4D one noticed the disadvantages compared to Blender. The Cinema4D community is by far smaller than the Blender community. Due to that, at times, looking for resolutions was a challenge - which in spite of that we were able to overcome. With the help of three.js (WebGL renderer) and react-three-fiber (three.js wrapper for ReactJS), we rendered the models into our application and connected them to the controls of the user interface. Given that three.js has a huge and active community with a vast amount of examples and tutorials, using react-three-fiber as a wrapper was hindering at times and was as well one challenge which had to be broken through. One thing we were determined about was that we wanted to create a fascinating and immersive experience, which supports the main feature, the questionnaire.

Artificial intelligence engine

Process

After our intensive research work, we realized that a machine learning approach would not have been appropriate for our use case. We wanted to determine which profession the user is best suited for, but a big disadvantage when working with neural networks is that it is not obvious to the user how this result was reached. We wanted the results to be comprehensible for the user as well as for the developers. It was important for us to have a transparent appearance to the users. Unfortunately, these requirements are very weak when working with a black box system like neural networks. For these reasons, we decided to use a knowledge-based system. This approach is in line with the field of explainable AI. Problems that arose were how we define our data model and where we extract our knowledge base from. We had to work closely with our psychologist to ensure that our system was psychologically sound and to avoid pitfalls such as bias. This process was very interactive and time-consuming. In the end, we created a proprietary system that met these requirements.

The Dynamic Inference Engine

Our dynamic inference engine automatically selects the questions to be picked next and goes through a dynamic tree. It calculates the score the user has for a profession and determines the professional skills the user has or not depending on the answers to the questions and gives an evaluation. It is an expert system that works with heuristics. It retrieves its knowledge base from the rules created with our psychologist (Jobanswer) and knows how a choice of an option to a question affects the job score.

Development

The technologies

  • Frontend: From the beginning, we were able to agree on web technologies in the frontend, since that is where the expertise of most of the team members lie. To build the user interface, we went along with the JavaScript library ReactJS and Redux, which we decided based on voting. In combination with Typescript, ReactJS offered us a great foundation for the development. The 3D visuals were build in Cinema4D and embedded with react-three-fiber, which is a React render for three.js.
  • Backend: When choosing the backend, we had decided to use Python in conjunction with Django. The background is that we made the choice based on the following criteria: What is the goal to achieve? Are there things that would help us significantly in our workflow? Which technology makes the most sense in our project? Once we defined the goals, we were also able to list alternatives that were tailored to our use case. NodeJS seemed to make the most sense to us because it would make the language (Javascript) consistent and then we could be more flexible in distributing tasks in the front and back end, however, we finally decided on Python and Django. The goal we were looking to pursue is that we wanted to create a system that prototypically illustrates what our system can do and Python and Django perform very well in this use case. Django offers both the ability to set up a SQLite DB without downloading additional dependencies and a fully integrated user role management system.

The development process

The goals and visions were set. At that point, the development phase started. In an agile fashion, we adapted methods from the scrum framework.

Diagram of the second phase of the project
Work flow

Since our schedules varied, we did not conduct daily meetings but rather had fixed weekly meetings, in which we planned the upcoming sprint backlog, conduct sprint reviews and retrospectives. If an additional session was required, we scheduled them spontaneously with the required team members. A sprint lasted for one week. Each team member reports on their sprint. What has been done? What is missing? Were there any impediments? What can be done to overcome these obstacles?

Screenshot of our Gitlab kanban board

We planned the sprint backlog and prioritized tickets in each meeting based on the principle: “what needs to be done”. The tickets were marked with predefined labels such as FE (Frontend) and BE (Backend) and sprint milestones to track the weekly sprints. The tickets were then distributed to each team member. Frontend and backend were developed in two separate GitLab Projects. We did not work based on feature branches and merge requests, since the code base and team were manageable. Technical and functional review requests were coordinated via chat. As this project solely took place remotely, pair programming was easy to organize and conduct.

  • Frontend: In the frontend, we worked on each screen step by step, which includes the roughly styled view and functionality. In the beginning, the functionality was our priority. In the course of the next sprints, we worked and refined the views. After the database was filled and the API was set, our previously collected data was now embedded into the frontend. In parallel, we worked on the 3D models and background animation, which were also embedded into the view.
  • Backend: In The backend, we focused on the inference engine. Firstly we started with a deep research on inference engine and the strategies we will use, then we created the rules of our strategy, then we decided how to build and implement our database and finally we started to develop our inference engine.

The deployment

The deployment process has been very pleasant. Our supervisor, David Koschnick, set us up with a server that was already accessible from the outside. SSL certificates for the domain were ready and the hardware-specific requirements were also met. We had to work with a Linux server, which was very easy due to the diverse development experience of some of the team members. Starting up the services was not a problem, as we were granted root authority and were therefore allowed to install everything. In some places in the frontend, the URL had to be changed as it pointed to localhost, so we created a .env afterward. The next step was to deploy the services to unoccupied ports. Then we had to think about how to make the frontend app accessible from the outside. Since ports 80 and 443 were already accessible by default, we only had to make sure that port 80 and the subsequent rerouting to 443 lead to our frontend app. We did this with an Nginx reverse proxy. The advantage is also that load balancing will be simplified in the future.