M1 Master GeZuMi

Team

  • Samuel Günther
  • Alain Ngoufack Nguefack
  • Florian Reitz
  • David Schach
  • Lena Vollmer

Supervision

Prof. Dr. Tobias Lenz

Design Evolution

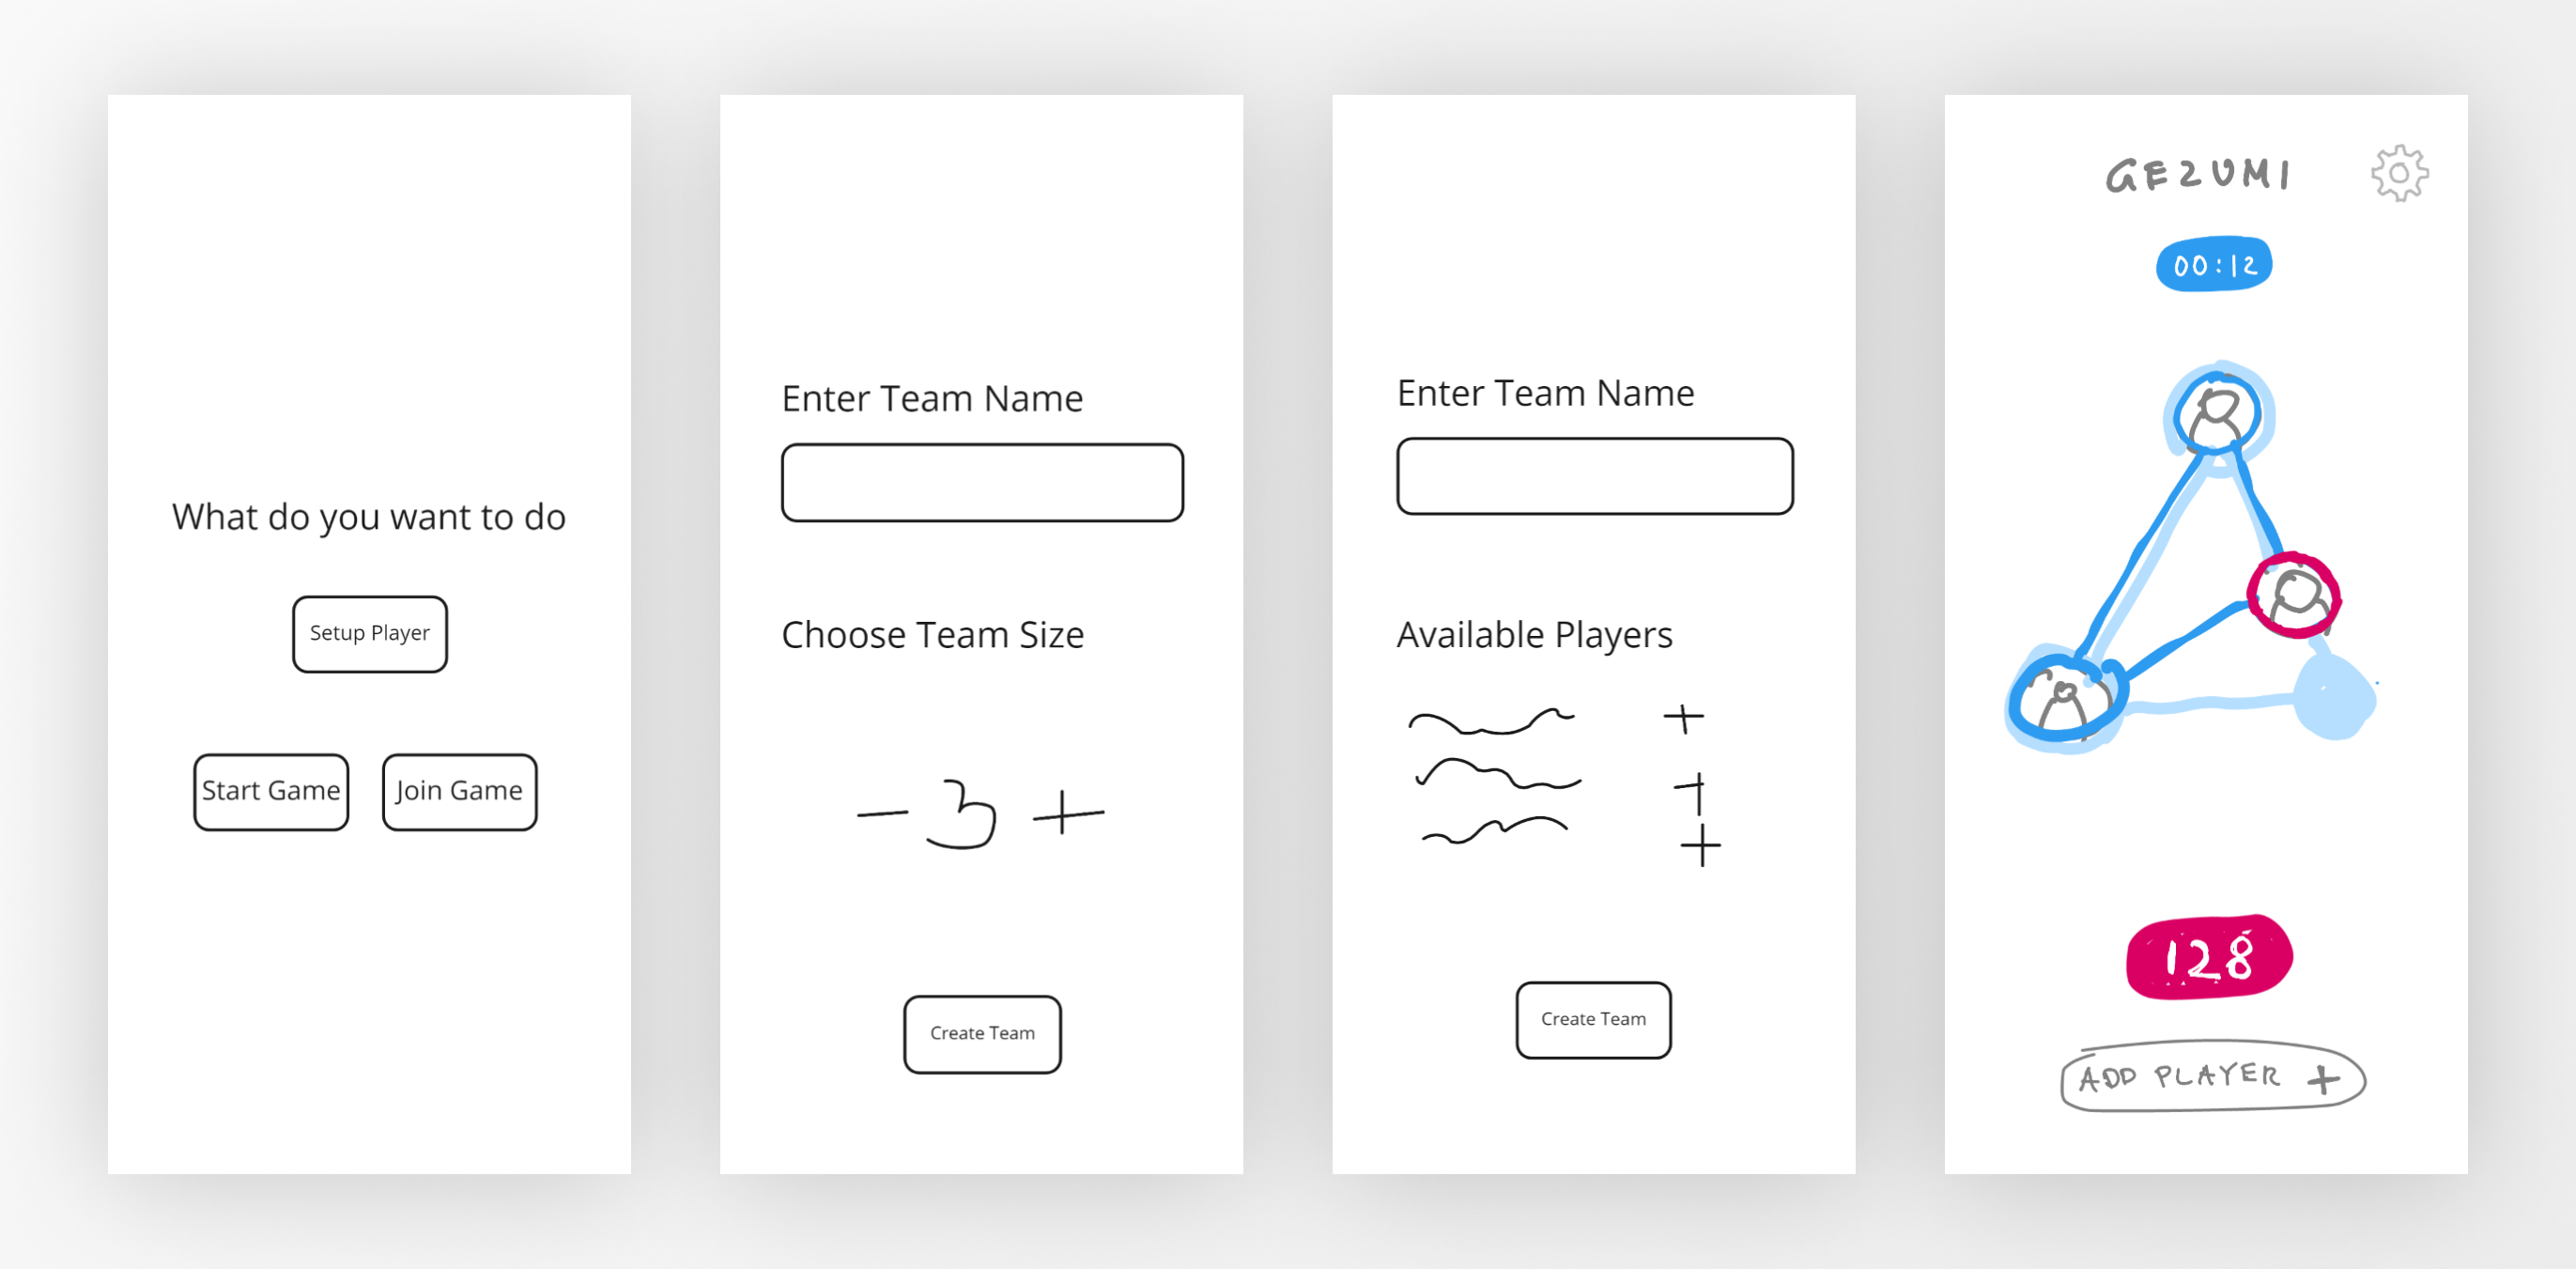
At the beginning, all ideas were collected on a Miroboard from which the following mock-ups were then developed (see image below). Players would land on a starting screen where they could select whether they wanted to start a new game or join an existing one. Two variants for the game-setup screen were mocked (screen 2 and 3). One would allow the host to manually select the players for a game, while the other alternative would randomly create teams based on all available, current app users. Additional settings, such as team size and the game’s duration, were considered as well. Not shown in the image are the potential features that were discussed in the beginning of the ideation phase, such as a ‘calibration round’ to potentially reduce the learning curve as well as a scoring system that would allow different teams to compete against each other.

First Mockups of the App

After the initial mockups, some very basic designs were created. These designs depended heavily on the mockups and were used to help the developers implement the actual interface.

First App Design

Different possibilities on how to visualize the game were tried out. In the mock-up, the plan was to color individual player positions as soon as they matched the target. During the implementation, it became clear that this was not technically possible with the chosen concept of position determination. Coloring the line between the players green as soon as they are correct was also considered (see image above). In the end, the decision was made to display the target shape in the background:

Different game mode

As the development progressed and more features were starting to get implemented, the final designs were created. These include the join and game-creation process and were based on an improved color scheme as well as calmer, more modern UI-components. As can be seen in below, the first, manual approach to setting up games was implemented. This was due to technical restrictions and to improve the ease of use.

Final App Design

The final implemented design can be seen below.

User flow gif

Workflow

The development process was split into one-week sprints, with a self-contained feature release and briefing with the project supervisor every other week. In weekly sprint meetings all team members were brought up to date and new goals were set for the upcoming sprint.

For pair programming, brainstorming or researching the team met in smaller sub-groups based on who was working on the respective task. To improve collaboration as a team and reflect on conflicts and impediments, a retrospective was organized whenever the need arose.

Due to the social distancing regulations, the process was fully organized through digital meetings. Toward the end of the project’s time-frame, in-person meetings became possible again and were used to focus on specific challenges and to prepare the show-time.

With Github Project each sprint iteration was organized (see image below).

Github Projects board

Obstacles

Inaccurate Positions

One of the biggest challenges during the project was obtaining accurate positions. With Bluetooth, the signal strength fluctuates very strongly. This was solved by filtering the measured signal values. The graph below shows how noisy the measured signal is (blue dotted line).

Various filter types and configurations, such as the Kalman filter and the running median filter, were implemented and tested. Overall, the running median filter proved to be the most accurate (blue line).

Despite the filtered values, no accurate distances could be calculated using the first versions of the distance calculation model.

With the help of the experimentally gathered data, the distance model could be adapted.


Another problem was that devices have different transmission powers. Depending on the calculation model, this can result in measurement errors of more than one meter. The developers of the Google API for Exposure Notifications encountered the same problem and therefore collected a list with data on the transmission power of around 12,000 devices. With some adjustments, this list was useable for the GeZuMi App to normalize the measured signal strengths. The chart below shows how this data was used to measure the distance for different devices.


Position updates come suddenly and not at regular intervals. That makes the game seem random and unpredictable at times. To prevent this we interpolate the position change and animate it over two seconds.

If a new position arrives in the meantime, the current animation is interrupted and the next position change is animated. Below you can see the position changes before and after filtering and interpolation.

BLE and Android Lifecycle

One challenge was the small community of BLE developers as it made finding support quite difficult. Google provides good documentation, however the tutorial was not very thorough and the search for material took a significant amount of time.

Another difficulty was how to gracefully handle the Android lifecycle in our App. A lot happens behind the scenes when an app is opened, paused or stopped. As the goal was to build a consistent application a solution for managing the connections and Bluetooth activity on Android events was indispensable. Should a client be disconnected from the game if they pause the app? When should the Bluetooth scanner be turned off to save power? Can the host reconnect to a game session?

Dealing with the limited size of Bluetooth packages was another big part of the Bluetooth implementation. To make the most of the limited package size, some filtering and masking for the environment scan had to be implemented. The built-in filter functionality for BLE scans caused some problems and did not work as intended which took us quite a bit to realize. Since we needed some extra filtering mechanisms anyway, we implemented our own masks for BLE scans.