- web application for visualization of IoT sensor data in building models
- anomaly detection analysis of measured values by calculating gradients and defining limit values for each sensor
- timeline chronological monitoring and comparison of sensor data
- mesh coloring colored representation of the measured values on sensor meshes in the 3D model
- sensor meshes documentation of sensor locations in the 3D model
Project Goals
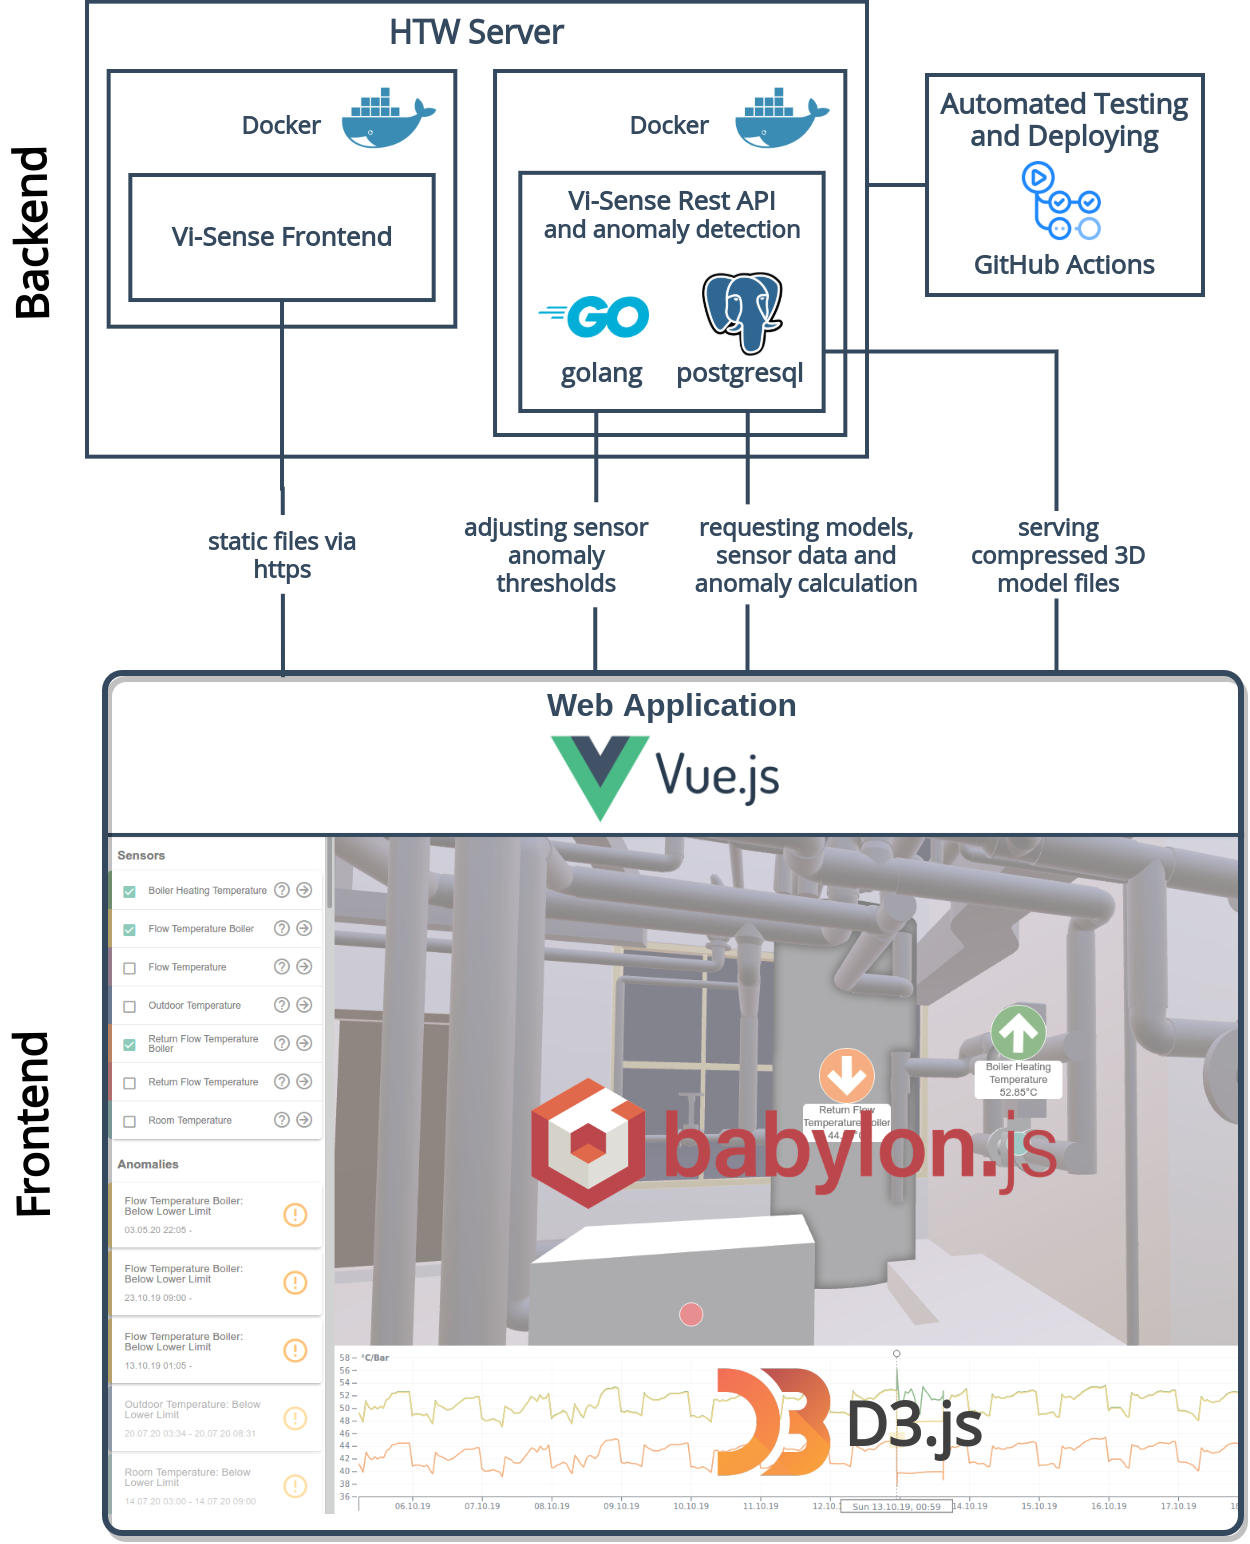
Project Structure