 Demo
Demo
 Source_Code
 Website
About the project
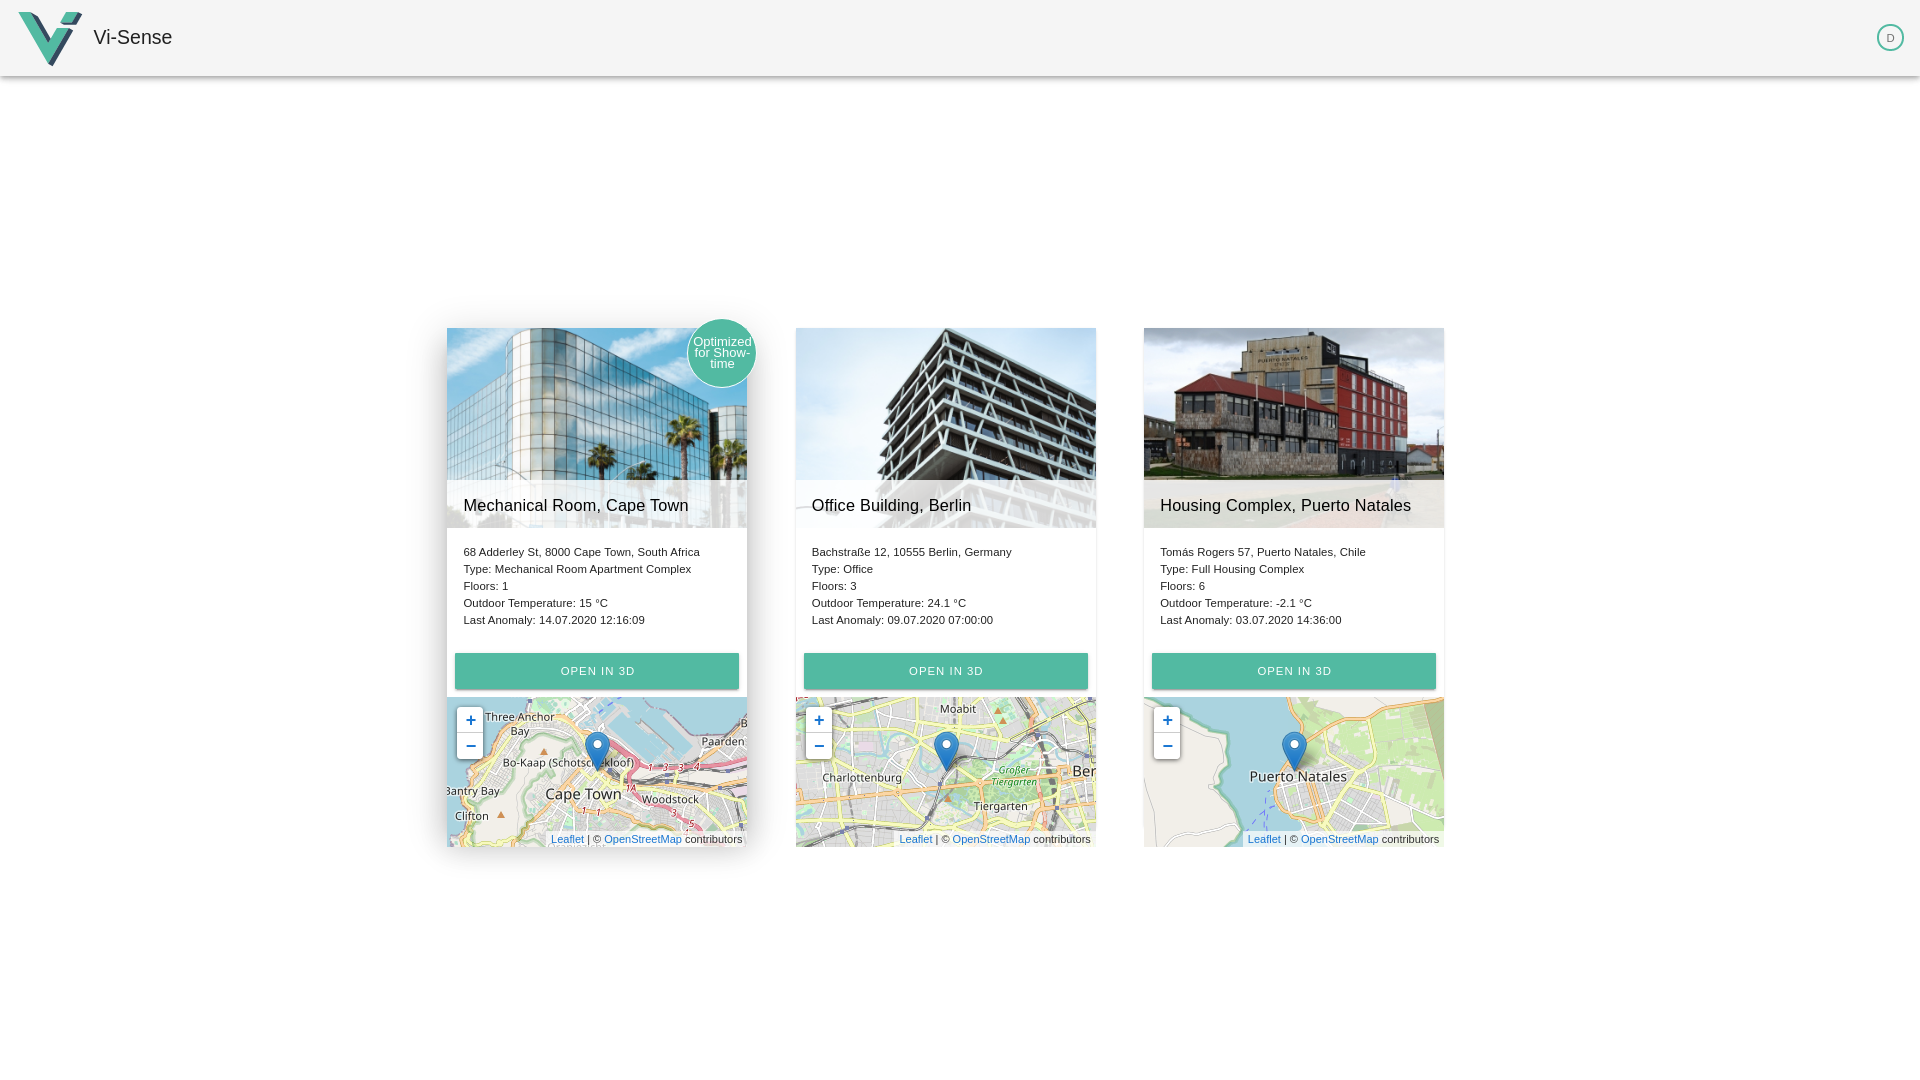
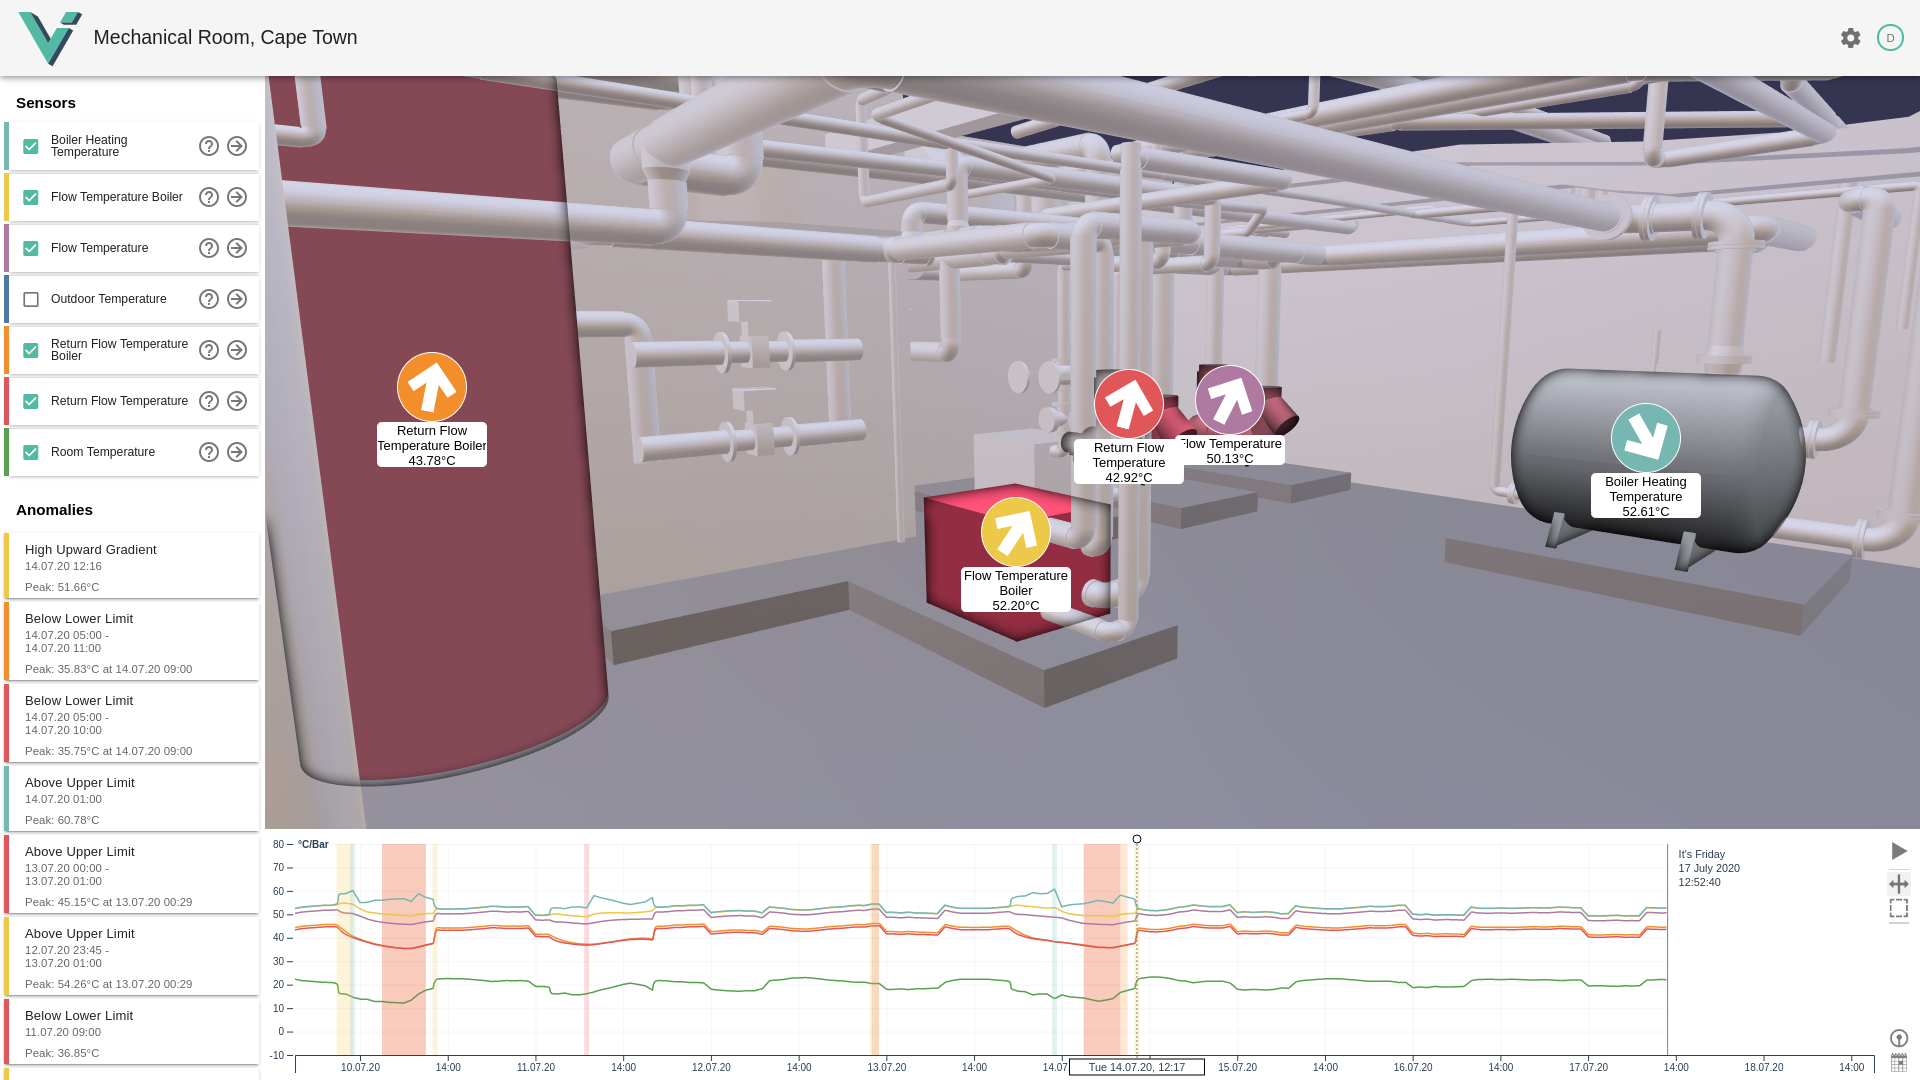
Vi-Sense is a project that visualizes data of heating systems in a 3D model of the building they’re installed in. Technicians or system administrators get an overview of all sensors located in a building, can take a closer look at the measured values of these sensors, and get information about data anomalies that indicate potential errors. The combination of the 3D representation of buildings and the visualization of measured values in a timeline makes it possible to perform detailed analyses of error sources such as the failure of heating or pump systems. In addition, sensor states in the building model are supported by color highlighting, which ensures a quick orientation and an intuitive overview. In short, the goal of Vi-Sense is to give technicians and building managers a clear overview of their properties and the sensor technology they use.


Presentation / Showcase
English Version
German Version
Link Collection
Live Testversion https://visense.f4.htw-berlin.de
Source Code Front-End: https://github.com/vi-sense/vi-sense-frontend
Back-End: https://github.com/vi-sense/vi-sense
Sample Data: https://github.com/vi-sense/sample-data
